
NCL World View – Update
The NCL raw data collection has been running continuously over the past few weeks and data has been collected for cities around the world. It seems time to update the world map from is previous version. So far we have covered 67 cities. However they are not all mapped yet. This will take a bit more time, but we are working on it.
In fact, so far we have in order of appearance:
New York, London, Munich, Paris, Moscow, Sydney, San Francisco, Barcelona, Denver, Hong Kong, Beijing and Chongqing. Further more the urban areas that need processing are: City
Abu Dhabi, Amsterdam, Athens, Atlanta, Bangalore, Basel, Berlin, Bogota, Boston, Cairo, Cape Town, Chicago, Doha, Dubai, Dublin, Glasgow, Guongzhou, Istanbul, Jakarta, Johannesburg, Lima, Liverpool, Los Angeles, Madrid, Manchester, Manila, Mexico City, Mumbai, New Delhi, Oslo, Rio de Janeiro, Rome, Sana’a, Santiago, Sao Paulo, Sfax, Shanghai, Sofia, Stockholm, Taipe, Tehran, Tokyo, Toronto, Tripoli, Tunis, Vancouver, Zagreb.
The NCL maps show a virtual landscape generated from geo located tweets sent from within a 30 km radius of the urban centre.
For now there is an updated world map of NCL world map with links to the individual locations. A link is provided to click through to the interactive and zoomable version of the individual urban area map. This will allow to explore the city of interest in more detail. It does now including the covered area. If you zoom in to a location the 30 km radius is plotted as an overlay.
For a large scale map click HERE. The maps were created using our CASA Tweet-O-Meter, in association with DigitalUrban and coded by Steven Gray, this New City Landscape represents location based twitter activity.
There are, as pointed out in earlier posts great variations between the cities activities on twitter. Also the number of geolocated tweets vary dramatically. So far Amsterdam is clearly leading the table with over 50% geolocated tweets. Compared the most active cities London and New York both on average send about 10% geolocated tweets.
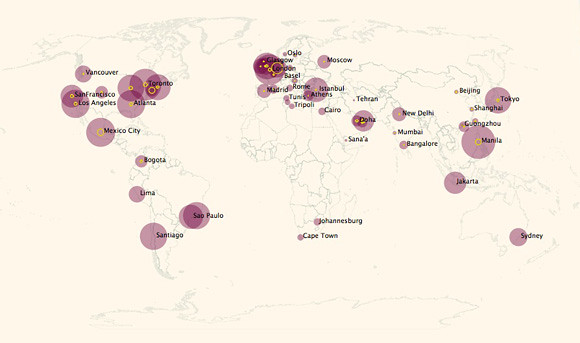
Image by urbanTick for NCL / Urban Areas with total number of tweets (purple) and total no of geolocated tweets (yellow)> This gives an idea of the relationship between tweets and geolocated tweets in different areas of the world.