
Twitter Wave in Honolulu
The tsunami wave, generated by the 9.0 magnitude earthquake of the East coast of Japan on the 11 March 2011, spread through out the pacific threatening many coastal sections in different countries. The water fore strongest hit the Japanese coast shortly after the earthquake. All other countries had a little more time to evacuate and prepare. Hawaii, was one of the next destinations in the line of the wave. The arrival was expected by NOAA, the tsunami warning centre, around 13h17 the same day.
Looking at the activity on twitter during the tsunami we are on the search for clues about the relationship between twitter and an unfolding natural disaster. As an inspiration to serves the XKCD PhD comic ‘Seismic Waves‘.
In this close look at twitter activity related to the tsunami resulting from the earthquake, Anders Johanson has animated the messages for one hour before and one hour after the expected arrival time of the tsunami wave in Honolulu on Hawaii. The messages are collected through the usual NCL collection method and are focusing on actual geo located tweets that contain lat/long information. Johanson explains “At the time instant when each new tweet is posted, a bright red blob appears on the map, and this blob is then decaying in intensity and size. Re-tweets are shown as an arrow, pointing from the original source of information. Interestingly enough, the information wave has the same direction as the seismic wave. However, there are obviously way too few data points to enable a rigorous spatio-temporal analysis in this case.”
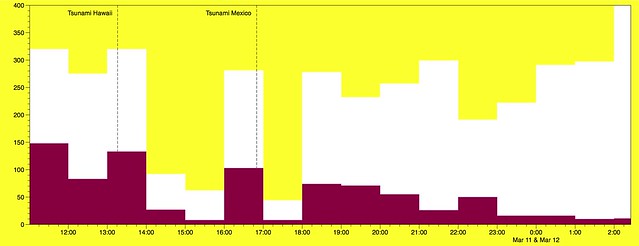
IMage by urbanTick for NCL / The graph shows the number of geo located tweets sent per hour from Honolulu, on 2011-03-11, in a radius of 30 km on the day the tsunami resulting from the earlier earthquake in Japan was expected to reach the Hawaiian coast. In white are the overal tweets and in purple the tweets containing the key words wave, tsunami and earthquake or Japan. The first dotted line from the left is the expected arrival time of the wave on the coast of Hawaii at around 13h07 UTC. The second dotted line is the arrival time of the wave on the coast of Mexico.
The tsunami arrived in Hawaii and hit hard, causing damages estimated to be in the tens of millions of dollars. On the twitter scape on the other hand, there is a slight increase of activity after the wave, but actually very little. However, as you can note in the graph above there are more tweets using the keywords related to the natural disaster unfolding than there are thereafter, especially after the wave arrived in Mexico.
——
UPDATE 2011-03-18
——
Processing the twitter data some further, the spikes on the keywords do fade out nicely in the hours afterwards. This time we are working with the larger data set containing all the located tweets including the geo located tweets. This data set differs from the one used earlier as that it included reverse geocoded locations, eg places, but not necessarily pure lat/long messages. This set contains some 260’000 messages as compared to some 20’000 geo located in the earlier dataset.
Looking at the event over longer period shows the pattern much clearer. There is a lot more activity around the expected tsunami wave and the dying out of the keywords can be observed in the following hours and days. However it also confirms that to some extend the purely geo located tweets, as a sub set, folow largely the same pattern and are not
Note, there is a baseline tweet containing the term ‘wave’ that we picked up as part of the collection. This is a weather boy just of Honolulu tweeting the current status of the water, wave and wind.
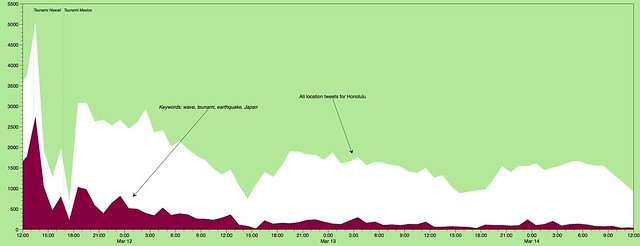
Image by urbanTick for NCL / The graph shows the number of geo located tweets sent per hour from Honolulu after 2011-03-11, in a radius of 30 km on the day the tsunami resulting from the earlier earthquake in Japan was expected to reach the Hawaiian coast. In white are the overal tweets and in purple the tweets containing the key words wave, tsunami, earthquake or Japan. The first dotted line from the left is the expected arrival time of the wave on the coast of Hawaii at around 13h07 UTC. The second dotted line is the arrival time of the wave on the coast of Mexico.