
NCL Zuerich – Activity Islands
Zuerich is the an important commercial centre for Switzerland. The city and the regio is home to a lot of international companies, a banking hub and as well as destination for a lot international celebrities or otherwise rich people to enjoying their wealth. With its international airport it maintains well establish international transport connections and let the location play a role in the European and international trade. For not being the political hub of Switzerland it is the busiest and largest agglomeration in the country.
It is however, in an international context a rather small hub with a population for the city and surrounding of just above 800’000 people. After a period of quite some decline of the urban quality in the late eighties and early nineties the city managed to turn these trends around and is since in a constant upwards trend. Zuerich featured for the past couple of years constantly in the top league of international city rankings, gaining points with the quality of urban spaces, ecology and sustainability. In the most recent Mercer 2010 list Zuerich features behind Vienna on the second place, just before Geneva, another Swiss city.
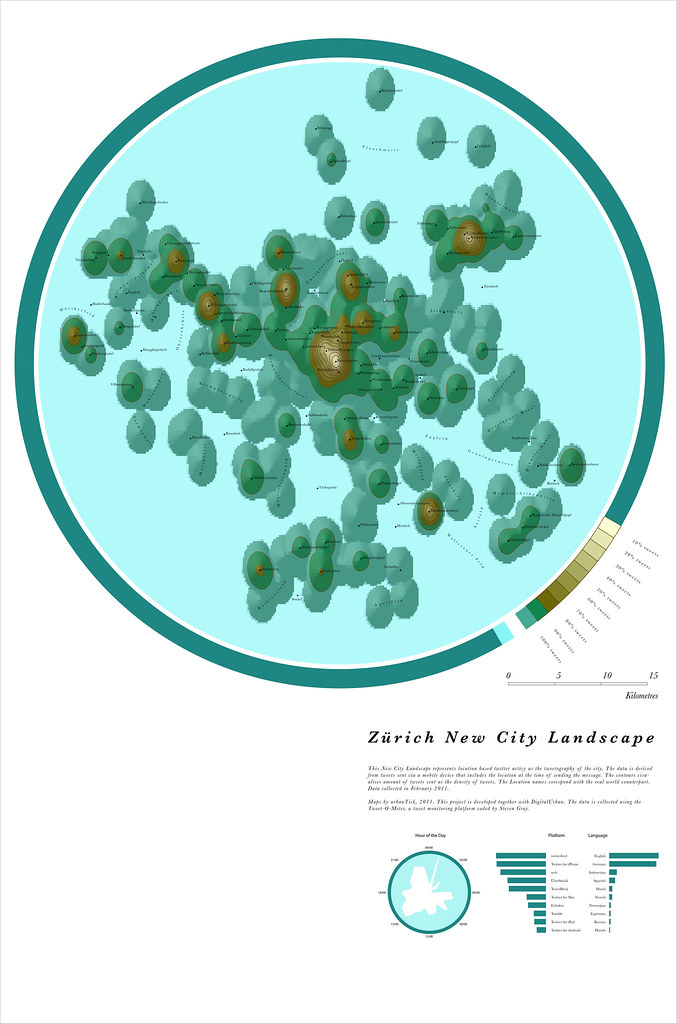
Image by urbanTick for NCL / Zuerich New City Landscape map generated from location based tweets collected over the period of one week. The area covered is within a 30 km radius of Zuerich.
The data for the Zuerich New City Landscape map has been collected earlier this year over the period of one week. In terms of its morphology the Zuerich landscape fits in with other cities showing independant island characteristics like Moscow or Sydney. The Zuerich New City Landscape (NCL) map is generated purely from geolocated tweets, sent over the period of one week using the devices GPS information. This is virtual landscape generated from tweet density sent from within a 30 km radius of Zuerich. NCL is an ongoing project, an world wide overwie of covered loactions can be accessed though HERE.
The ‘Bahnhofspitze’ above the main train statino is definitely the highest feature of the virtual landscape. It probably shows the importance of the city as a hub also for other regions of the country. With its relative proximity of the important cities there is a lot of commuting between the centres and Zuerich plays an important role, attracting a lt of workers on a daily basis from Basel and Bern as well as international. With the train network being extremely sophisticated and reliable it is the transport of choice for most of the traveling between the centres, hence the arrival or point of departure being the important feature.
Zuerich New City Landscape
Image by urbanTick using the GMap Image Cutter / Zuerich New City Landscape -Use the Google Maps style zoom function in the top right corner to zoom into the map and explore it in detail. Explore areas you know close up and find new locations you have never heard of. Click HERE for a full screen view. The maps were created using our CASA Tweet-O-Meter, in association with DigitalUrban and coded by Steven Gray, this New City Landscape represents location based twitter activity.
The timeRose over the twenty four hour period shows the twitter activities in Zuerich overall a mainly during the day. There is a fat mid day bit with people spending some on the platform. It looks as if people send in average only about one message around the lunch brake. Also now we feature data on platform used and language. Here the software of choice is the twitterfeed, followed by the twitter for iPhone app and the web. The twitter for Androids app only features at the very end of the top ten. It seems that Zuerich is a mac dominated market, at least for location based tweeting.
The international context is also supported by the fact that the English leads the table of the top ten used languages. German is only on second place. The top ten list also features Indonesian, Spanish, Dutch and French as group of languages used in the Zuerich area.
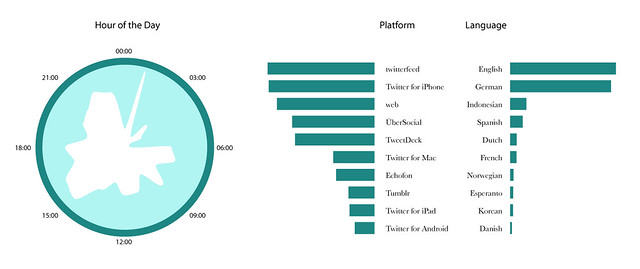
Image by urbanTick for NCL / The rose shows the twitter activity over the tweet activity per hour of the day, starting at 00:00 at the top. Here we are showing Zuerich local time. Hence the characteristic dip between three and five o’clock in the morning. Zuerich is a typical midday city with more activity around lunch time. The graphs show the platform of prefernce used to send the tweet and the language set respectively.
The data set is also animated in the aNCL series, coded by Anders Johansson and shows the whole set superimposed over the period of a twenty four hour period. The connecting lines indicate the dissemination of information between the individual users of the data set. Is a message retweeted by a fellow twitterer the visualisation draws a line with a traveling dot between the two location, starting at the initial senders position moving towards the position of retweeting by another twitter user.
Zuerich is in this context not very active at least it is not reflected in this data set. The previously animated San Francisco aNCL showed a lot more activity in this respect.
This animation is developed in collaboratively Anders Johansson and urbanTick. The data was collected using our CASA Tweet-O-Meter tool, coded by Steven Gray, in association with DigitalUrban.
There is more to come. We will be working our way through the NCL data collection of over 70 cities from around the world. Within the next week will be posting the next city to continue this aNCL (animated New City Landscape) series.