
Book – Tufte Visualisation Theory
Eduard Tufte is one of the key theorist on visualisation design and graphics communication. His books have sold extremely well and his concepts have been picked up by a lot of influential designers. He is quoted frequently in writings and has very large follower basis.
Even though his books, six there are published by his own publisher Graphic Press, are already published for more than a decade, in fact his first important book, The Visual Display of Information was first published in 1983. All of the publications are by now into their second edition and still selling strong at a retail price of above $40.00.
The New York Times called him The Minister of Information, to name but one example of titles he was given. Tufte lectures around the world always drawing a large crowd.
Tufte started teaching at Princeton together with the renown statistician John Tukey where the foundations for the first book The Visual Display of Information was developed. The second edition of this publication (2001) is then also dedicated to the memory of Turkey.
This first book on graphics and information design was an instant success and transformed Tufte from his political science background into an information visualisation expert. With the publications that followed he sticked with this new field of his and extended on a number of concepts in the field of visualisation of quantitative information.
Two qualities of Tufte’s book are standing in the foreground. For one there is the quality of the publication design and there is the beauty of the numerous examples drawn from across the centuries. In combination, together with a solid argument and visionary, but detailed observations it creates a extremely powerful statement which is pure joy to read.
Even thought he publications are of some age, they currently live through a revival, in the context of the current data visualisation hype. With these wast depositories of quantitative information accessible the chalenges of visualisation are still as present as ever and often the readability and the presentation is compromised.

Image taken from Businessweek / An examples of the use of Tuftes Sparklines intended to be in text graphs summarising the development of time as extensions to textual or numerical descriptions.
In his first book The Visual Display of Information Tufte (1983) sets out to develop a language to discuss graphics and a practical theory of data graphics. As Tufte puts it in his foreword to the publication: “At their best, graphics are instruments for reasoning about quantitative information.” He mainly bases his explanations on the comparison and the discussion of examples. Very didactically Tufte relays predominantly in his descriptions on “this is not very good! It could be improved in this way!”
In this sense the first part of the book is focusing on the history, as Tufte puts it, the recent history, of graphicsal representation of information since the 18th century. Tufte refers to William Playfair (1759-1823) as the main inventor of a theory and practice of information graphics.
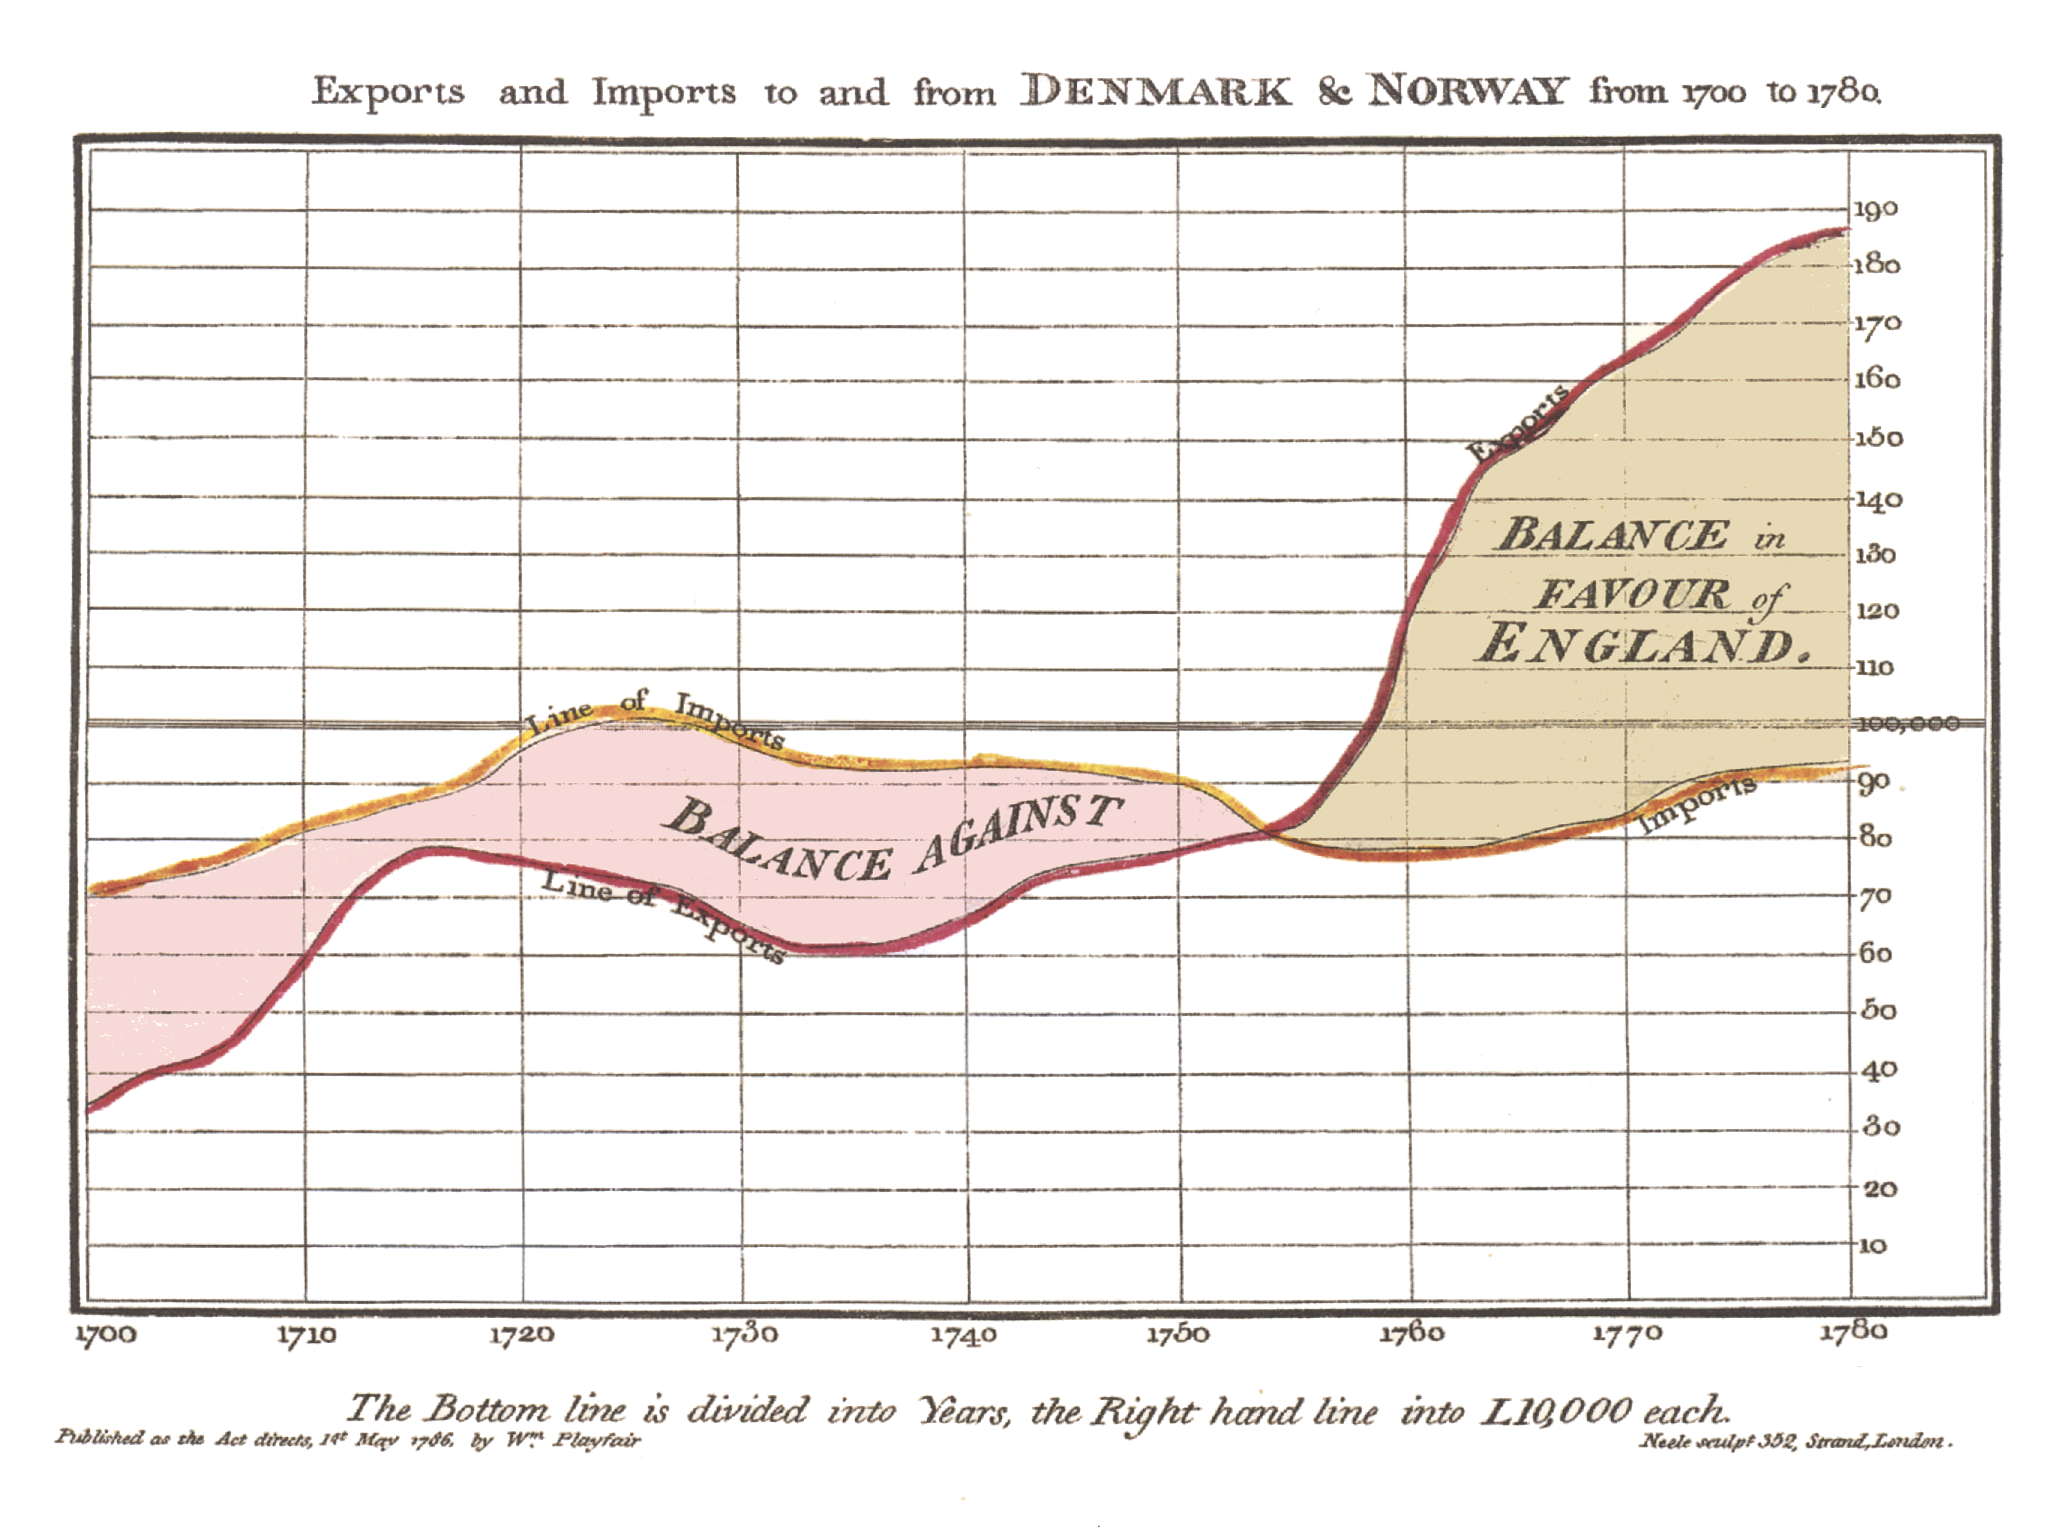
Image taken from Wikipedia / William Playfair’s Time Series of Exports and Imports of Denmark and Norway
In the conclusion to the book, the chapter 9. Aesthetics and Technique in Data Graphical Design Tufte brings together the observations made through out the book and makes suggestions for design decisions in regards to the graphical representation of quantitative data. It is simple things Tufte picks up here, like line with, chart size and orientation or shading, but those are the main tools of communication and what generally is overlooked.
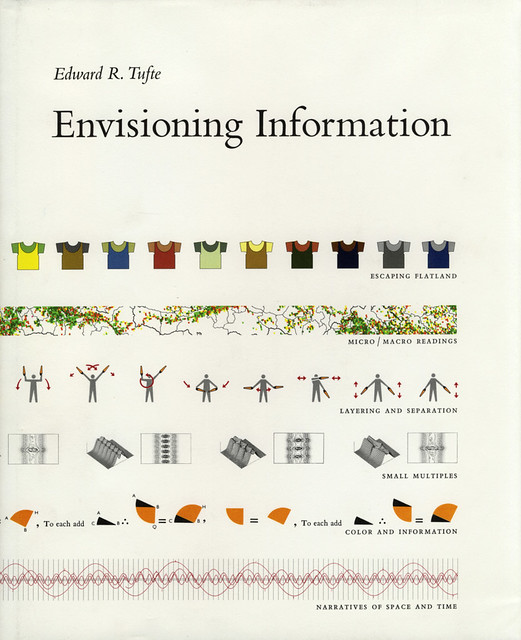
It is only in his second book Envisioning Information that Tufte (1990) opens the discussion to include more aspects of graphical representation, sort of departing from the initial focus on quantitative data, math and statistics. In this publication Tufte incorporates much more and this is well reflected in the content that reads: Escaping Flatland, Micro/Macro Readings, Layering and Separation, Small Multiples, Colour and Information, Narratives of Space and Time. Here Tufte incorporates the visualisation and style of maps, train time tables and information signs.
It is in this book that Tufte actually discusses the impact of the design and the potential as it is evoked through good choice and specific planning. Where the first book ends, with practical suggestions, this area is extended in this second publication into a whole book really. And it is in these chapters, as listed previously, the reader finds the evidence and the presentation of again comparative examples leading the discussion.
In many ways these two books come as one and it does make sense to read them in sequence and still each book has its perfect identity. For even if your not into the practice of graphical representation of either quantitative data or any information at all it is great joy to look through the books and admire the perfect layout along with the stunning collection of examples each surprisingly comprehensive and integrative with the developing discussion of the book.

Tufte, Eduard R., 2009. The Visual Display of Quantitative Information Second Edition., Cheshire, Co: Graphic Press.
Tufte, Edward R, 1990. Envisioning Information, Cheshire, Conn: Graphics Press.