
Natural Disasters and Crowdsourcing: Haiti
Natural disasters such as earthquakes and tsunamis occur all over the world, altering the physical landscape and often severely disrupting people’s daily lives. Recently researchers’ attention has focused on using crowds of volunteers to help map the infrastructure and devastation caused by natural disasters, such as those in Haiti and Pakistan. For example, in the movie below shows the response to the earthquake by the OpenStreetMap community within 12 hours of the earthquake. The white flashes indicate edits to the map (often by tracing satellite/aerial photography).
While this data is extremely useful, as it is allows us to assess damage and thus aid the distribution of relief, but it tells us little about how the people in such areas will react to the devastation, the supply of food, or the reconstruction. To address this, we are exploring how agent-based modeling can be used to explore peoples reactions. To do this we have created a prototype spatially explicit agent-based model, created using crowdsourced geographic information and other sources of publicly available data, which can be used to study the aftermath of a catastrophic event. The specific case modeled here is the Haiti earthquake of January 2010. Crowdsourced data is used to build the initial populations of people affected by the event, to construct their environment, and to set their needs based on the damage to buildings.
The idea behind the model is to explore how people react to the distribution of aid, as well as how rumors propagating through the population and crowding around aid distribution points might lead to food riots and similar social phenomena. Such a model could potentially provide a link between socio-cultural information of the people affected and relevant humanitarian relief organizations.
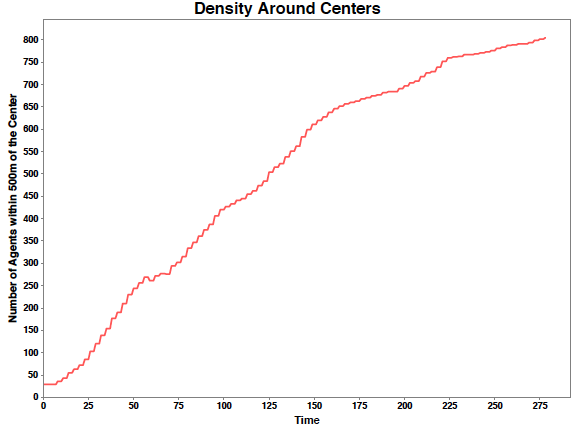
The animation above shows one simulation run where there is the spread of information and agent movement (red dots) around one center (blue dot). While the chart below shows how over time the density of agents around the food station increases over time.
The idea behind such a model is one can take crowdsourced information and fuse it into an agent-based model and see how people will react to the distribution of food centers. For example, the movie below shows how agents find out about four (hypothetical) different food centers and decide whether or not to go to them in a 6 by 8km area of Port-au-Prince.
Spread of information and agent movement (red dots) in a 6 by 8km area of Port-au-Prince.
More details about this model to come……