

Virtual Landscape and a Peak for the London 2012 Olympic Park
I will be speaking at the Society of Cartographers 48th Annual Conference today. The talk will focus on the New City Landscape maps under the title New City Landscape Maps: Urban Areas According to Tweet Density.
The maps are visualising location based tweet activity in urban areas and part of the talk will focus on urban morphology and real world feature to influence the virtual activity. The range of maps produced show that unique conditions exist for different cities from around the world and this is reflected in the Twitter landscape maps.
Three types have been identified showing similar characteristics. A type with one central core are, a type with several different islands of high activity and a type showing an area or shape of high activity.
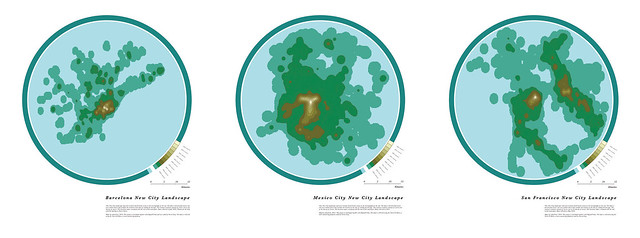
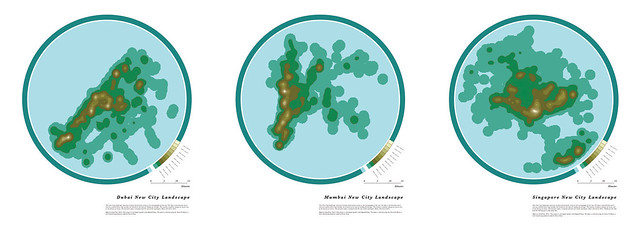
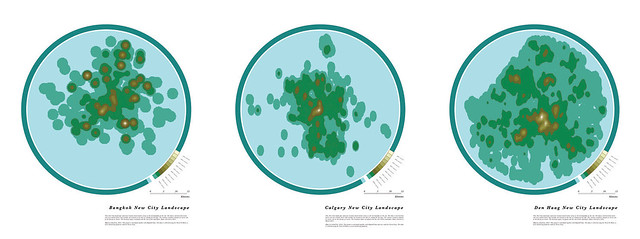 Image by urbanTick for NCL / Top row central type, middle row feature type and bottom row island type.
Also we have been monitoring Twitter activity in London during the London 2012 Olympic and Paralympic Games. Whilst this is still ongoing a first preview of the data is showing a surprising shift of activity, a new addition to the landscape of the NCL-London map respectively.
There has an actual peak appeared over the area of the Olympic park with masses of location based tweets. It is something we have always talked about in presentations of the maps in the past couple of month and here it is, it finally did show up as a major ‘landmark’ in the virtual map of London.
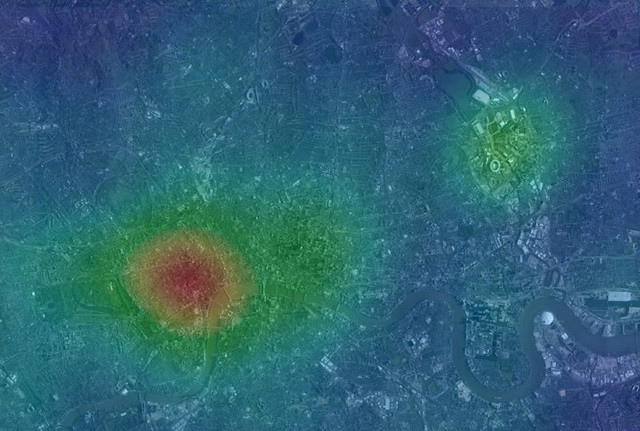 Image by urbanTick for NCL / Locationbased Twitter activity in London during the London 2012 Olympic Games. The Olympic park on the right does show up as a remarkable peak during the early period of the Olympic Games. A final version will be produced in the after the end of the Paralympic Games.