Launching LuminoCity GB: Urban Form and Dynamics Explorer
Our cities have been changing dramatically in recent years, with the intensification of urban centres, redevelopment of old industrial spaces, new demographic trends, and the pressures of a volatile global economy. The aim of the LuminoCity website, which launches in beta today, is to visualise urban form and dynamics to better understand how these trends are transforming cities in Great Britain. Explore the site for yourself here- luminocitymap.org.
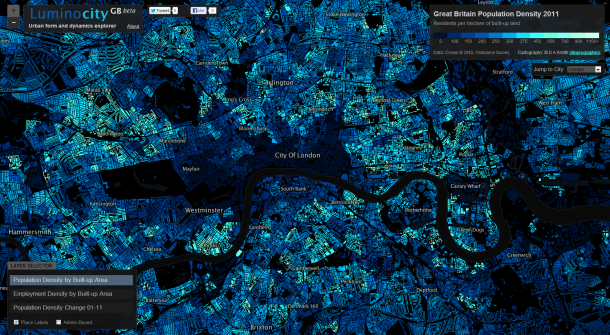
The visual style developed for LuminoCity combines urban activity data with built-form. Density values are calculated by dividing fine-scale (LSOA) employment and population data by built-up area, and then mapping the results to the same building footprint data (Ordnance Survey VectorMap). The result is a novel city perspective on common demographic indicators like population and employment density, with links between density and the texture of the built-environment clearly highlighted. So for example in the London map above, we can see the patchwork pattern of recent high density developments in Docklands (along the river to the east), and high density clustering around major rail stations like Paddington.
There are three layers included in the beta version of LuminoCity-
- Population Density by Built-up Area 2011
- Employment Density by Built-up Area 2010
- Change in Population Density 2001-2011
Each layer provides a complementary angle on urban form, with Employment Density showing business agglomeration patterns, and Population Density Change highlighting where intensification is occurring and where population losses are found. Examples of these three layers for major cities are shown above. The Population Density Change is particularly interesting in light of clear patterns of city centre growth and static or declining suburbs in many British cities, such as Manchester above. There is also in London a distinct pattern of population loss in the western inner-city, likely due to international capital speculation leaving under-occupied housing (see image below). These trends will be discussed in a further post later this week.
Multi-Scale Interactive Statistics
As well as browsing the map you can also click on particular locations to get a set of core statistics and rankings of that area for the current map layer. The statistics are at three spatial levels- City Region, Local Authority and LSOA. This feature shows how typical a particular area is compared to the wider city-region and the country as a whole. It also helps to communicate the variation in density measurements according to scale.
Site Credits
The data used for the LuminoCity site is Crown Copyright Office for National Statistics, National Records of Scotland and Ordnance Survey. Cartography and site design by Duncan A Smith. The map layers were produced using the excellent TileMill software by MapBox.
The site concept was partly inspired by Ollie O’Brien’s ‘New Booth’ Map of Deprivation for Great Britain.
Datasets Used
The population data comes from the UK 2001 and 2011 Census, published by Office for National Statistics and National Records of Scotland. The employment data is derived from the Business Register and Employment Survey 2009-2011, also published by Office for National Statistics. The building footprint and urban area data is from the Ordnance Survey Vector District and Meridian products. These datasets have been published by the OS as Open Data, which is a fantastic recent development enabling sites like this to happen.
Spatial Analysis Method Details and Errors
All socio-economic mapping contains a degree of error, and the building footprint density approach used here introduces some issues. The Lower Super Output Area zone geography at which the population and employment data is published is fine scale but is not at the individual block level. Each LSOA zone represents groups of adjacent city blocks. The density results are therefore an average of the adjacent blocks in each zone. The results are affected by a particular version of the Modifiable Areal Unit Problem, and represent the density of fine-scale city neighbourhoods rather than of particular buildings. You can view the specific geography of the LSOA zones by turning on the ‘Admin Boundary’ layer on the LuminoCity site to see how blocks are aggregated.
Additionally the analysis does not consider building use (there are several technical and copyright challenges with this) and so population and employment density measures include all buildings rather than distinguishing residential and commercial property densities.
Finally, the ONS has not yet published census 2001 and 2011 population counts at the same LSOA geography, and a proportional spatial join method by building area was used to convert the 2001 LSOA census data to 2011 LSOAs for the Population Density Change layer.
Feedback and Comments
If you like the site or have any feedback or comments then you can tweet me @citygeographics, or email duncan2001@gmail.com. The site is in beta at the moment, and I plan to add more layers and interactivity in future releases. I’ll be blogging here in more detail about what the visualisations reveal about the changing geography of British cities over the coming weeks.


