
Rediscovering the Old Days
I first met Leo Kadanoff in Cambridge, England in the summer of 1974, I think. He would not remember me but he had been invited to give a talk on urban dynamics at the second Cambridge Land Use and Built Form Studies Conference on Urban Development Models as he had published an article in Simulation (From simulation model to public policy: An examination of Forrester’s ‘Urban Dynamics’) in 1971 which speculated on how to improve Jay Forrester’s model which was an example of how to apply Systems Dynamics to Cities. Forrester’s work attracted a lot of attention in those days as he had produced a simulation of a city which had no space – it was the central city but – lots of time – dynamics – and it did not manifestly allude, by his own admission, to anything that had been produced in urban theory and models so far.
Kadanoff gave an inspiring talk, I remember, but I did not know his background other than the fact that he was a physicist and assumed his interest in cities was a one off. It was not until many years later once I had encountered ideas about fractals and scaling, that I realised that it was the same Leo Kadanoff who had been one of the architects of renormalisation theory in statistical physics. And his YouTube clip puts all this in perspective.
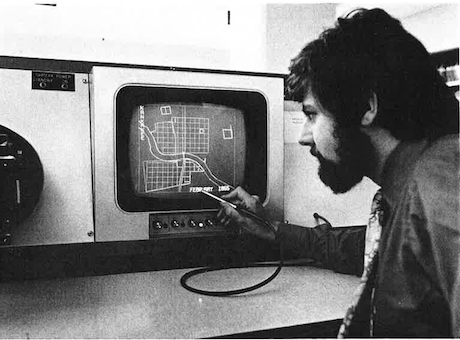
More recently, I came across another article by him and his colleagues (Computer Display and Analysis of Urban information Through Time and Space) published in the second volume of Technological Forecasting and Social Change published in 1970 one year earlier than his Simulation article. What is amazing about this first paper is how prescient it is. Not only is it about early computer graphics in our field and those who follow my complexcity.info blog will know that I spent a few years in the 1980s reskilling in computer graphics but it is also about the limits to modelling. On my blog you will find a potted history of computer graphics in our field but this article is one of the first to show the power of interactive visual display. Not only is planning support and interactive visualisation anticipated, but the notion of interactive design of urban futures is hinted at.
You may say what is remarkable about all this. Many people anticipated this and yes they did. Well, it is very early work of course and fills in a bit more of the picture. It happened in parallel to Alan Schmidt’s East Lansing movie and the genesis of GIS at the Harvard Computer Graphics Lab. And it also built on the first interactive devices used in the Chicago Area Transportation Study in the late 1950s where Illinois Institute for Technology was pioneering the Cartographatron (There is a picture in my New Science of Cities book). All of this is on my blog but the Kadanoff paper is well worth looking at and you can get a copy if you click the link here. The article which is online by the journal is an awfully bad scan and the one I have made here is better.
Last but not least, what all this implies is that we are able to rediscover the past as virtually everything gets scanned and published on the web. I would not have found this but for the web. I never would have gone back to look at this journal. I don’t think it was even in the Reading University library back in 1971 when it appeared when I was a lecturer there. I would have had to get it on interlibrary loan and my guess is that it simply didn’t appear on my radar. There are many others things now that we are discovering about the past which help fill in the picture of how our field has evolved and is evolving. My last post about large scale models also linked to literature from past times that we are only becoming aware of. This to me is as important as new work for it establishes a perspective on our field.