Mapping Geodemographic Classification Uncertainty
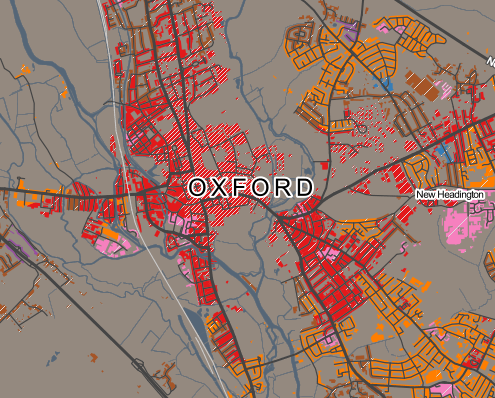
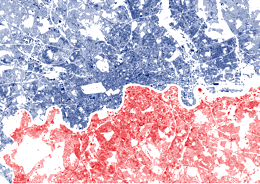
I’m presenting a short paper today at the Uncertainty Workshop at GIScience 2014 in Vienna, looking at cartographic methods of showing uncertainty in the new OAC 2011 geodemographic maps of the UK using textures and hatching to the quality of fit of areas to their defined “supergroup” geodemographic cluster.
Mapnik was used – its compositing operations allow the easy combination of textures and hues from the demographic data and uncertainty measure onto the same tile, suitable for displaying on a standard online map.
These are my presentation slides:
Here is a PDF of the short paper: