

OpenLayers 3 and Vector Data
As part of a project to move most of my OpenLayers 2-powered websites to OpenLayers 3, I have recently converted two more – DataShine: Travel to Work Flows and the North/South Interactive Map. Unlike the main DataShine: Census website, both of these newer conversions include vector geospatial data, so there was additional learning involved during the migration process, mainly relating to vector styling.
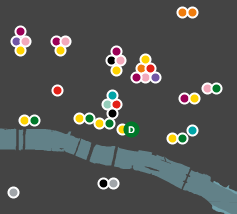 North/South Interactive Map
For the North/South Interactive Map, I made use of the loading in of remote GeoJSON files.
Vector Layers
Here’s a vector layer:
layerPoints = new ol.layer.Vector({

    source: pointSource,

    style: function(feature, res) { return pointStyle(feature, res); }

});
The pointSource is a ol.source.GeoJSON, which requires the projection of the files to be defined, as well as that to be displayed, when defining the source for the Vector layer:
pointSource = new ol.source.GeoJSON({

    url: '...',

    defaultProjection: 'EPSG:4326',

    projection: 'EPSG:3857',

    attributions: [ new ol.Attribution({ 'html': "..." }) ]

});
If you wish to do further operations on your data once it is loaded in, you need to add a listener to a remotely loaded (e.g. GeoJSON file) source included within a Vector layer:
pointSource.once('change', function()

{

    if (pointSource.getState() == 'ready')

    { var features = pointSource.getFeatures(); ... }

};
Here’s a typical style function. I’m using a property “highlight” on my feature to style such features differently:
function pointStyle(feature, resolution)

{

    return [

        new ol.style.Style({

            image: new ol.style.Circle({

                radius: (feature.highlight ? 7 : feature.radius ),

                fill: new ol.style.Fill({ color: feature.fillColor }),

                stroke: new ol.style.Stroke({ width: feature.strokeWidth, color: '#fff' })

            }),

            text: new ol.style.Text({

                text: (feature.highlight ? feature.label : ""),

                font: '9px Ubuntu, Gill Sans, Helvetica, Arial, sans-serif',

                fill: new ol.style.Fill({ color: '#fff' })

            })

        })

    ]

};
Interactions
To detect clicks, I used an ol.interaction.Select – N.B. if you don’t specify which layers it applies to, it tries to apply them to all Vector layers!
	var selectClick = new ol.interaction.Select({

    condition: ol.events.condition.click,

    style: function(feature, res) { return pointStyle(feature, res); },

    layers: [layerPoints]

  	});
selectClick.getFeatures().on('change:length', function(e)
{ ... }
olMap.addInteraction(selectClick);
In my function here I remove the flag from any already highlighted features and call features[i].changed(); to get the non-highlighed style. You don’t need to call this on what you’ve actually clicked on, as this is done implicitly. here’s likely better ways of showing selected/highlighted features, using ol.FeatureOverlay, but i couldn’t get this to work.

MousePosition
There’s quite a nice new utility function which means it was little effort to get an “old style” location indicator in, at the bottom of the North/South interactive:
new ol.control.MousePosition({ projection: "EPSG:4326", coordinateFormat: ol.coordinate.toStringHDMS, className: 'olControlMousePosition' })
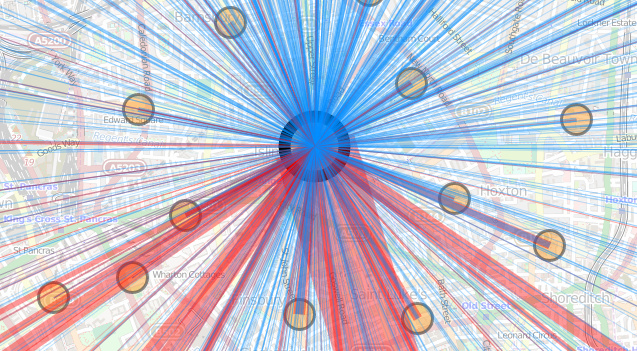
DataShine: Travel to Work Flows
This loads vector data in as generic JSON through a regular (non-OL) AJAX call rather than GeoJSON so the processing is a bit more manual. This time, my source for the Vector layer is a simple ol.source.Vector which can be emptied with source.clear(); and reused.
I’m creating lines directly from the JSON, converting from OSGB grid and specifying colour (for the style) as I go – note my use of rgba format, allowing me to specify a partial transparency (of 60%) for the lines:
			var startLL = ol.proj.transform([data[start][2], data[start][3]], "EPSG:27700", "EPSG:3857");

			var endLL = ol.proj.transform([data[end][2], data[end][3]], "EPSG:27700", "EPSG:3857");

			var journeyLine = new ol.geom.LineString([startLL, endLL]);

			var lineItem = new ol.Feature({ geometry: journeyLine });

			lineItem.strokeColor = 'rgba(255, 0, 0, 0.4)';				lineSource.addFeature(lineItem);
…
As previously blogged, I’m also using hand-crafted permalinks in both websites, and drag-and-drop KML display and UTF grid mouseovers in the latter, and both have also had their stylesheets tweaked to allow for easy printing – again made possible with OL3.
I’m about ready now to tackle my most complicated OpenLayers project by far, the Bike Share Map.