General Election Maps for 2015
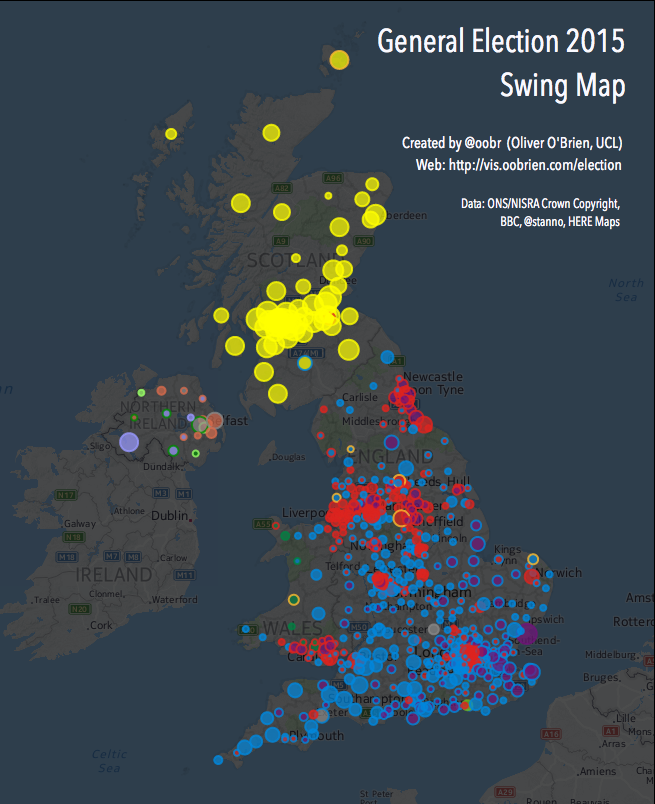
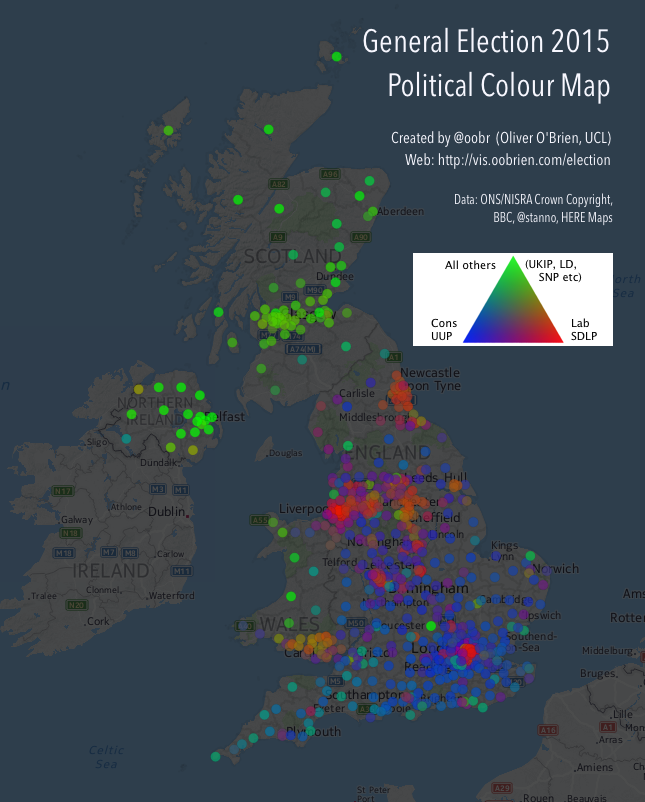
When I first moved to UCL CASA back in 2010, the first online map I created from scratch was one showing swings in the general election that year. So it seemed fitting to update the old code with the data from the 2015 general election, which took place last week. You can see the resulting maps here – use the dropdowns to switch between headline swing, winner, second places, turnout % variations, majorities, political colour and individual party votes and X-to-Y swings.
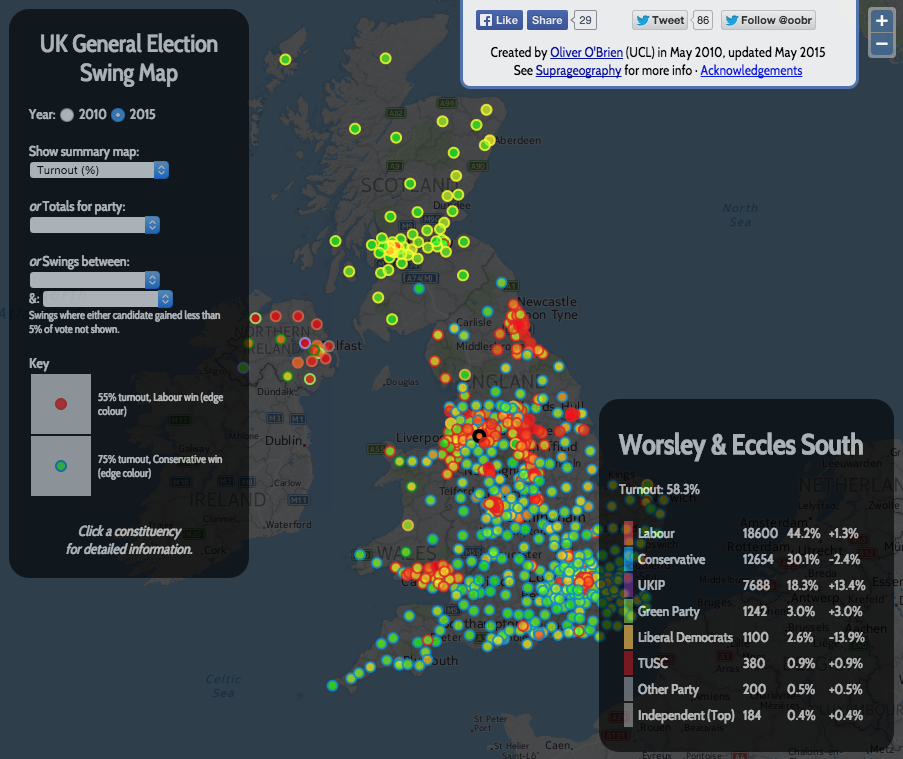
My style of Javascript coding back in 2010 was – not great. I didn’t use JQuery or event AJAX, choosing instead to dump the results of the database query straight into the Javascript as the page was loaded in, using PHP. I was also using OpenLayers 2, which required some rather elaborate and unintuitive coding to get the colours/shapes working. My custom background map was also rather ugly looking. You can see what the map looked like in this old blog post. I did a partial tidyup in 2013 (rounded corners, yay!) but kept the grey background and slightly overbearing UI.
Now, in 2015, I’ve taken the chance to use the attractive HERE Maps background map, with some opacity and tinting, and tidied up the UI so it takes up much less of the screen. However, I decided to leave the code as OpenLayers 2 and not AJAX-ify the data load, as it does work pretty well “as is”. The constituency boundaries are now overlaid as a simplified GeoJSON (OL 2 doesn’t handle TopoJSON). For my time map, I was using OL 3 and TopoJSON. Ideally I would combine the two…