
Mapping the Global Urban Transformation
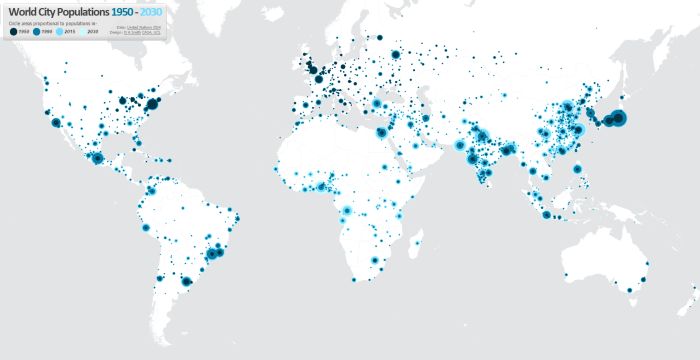
One of the best datasets for understanding the explosive growth of cities across the world in the last 75 years in the UN World Urbanisation Prospects research, which records individual city populations from 1950 to 2014, and includes predicted populations up to 2030. I have been meaning to create an interactive map of this fascinating data for a while, and have now completed this at- luminocity3d.org/WorldCity/
The map uses proportional circles representing city populations in the years 1950, 1990, 2015 and 2030, highlighting the regions in the globe with the most spectacular urban growth, and the time period when this growth occurred (I first saw this technique used in a static map at LSE Cities Urban Age). Naturally China, India, Africa and Latin America jump out in the map, while Europe is largely static (except for Turkey). You can also explore time-series graphs and statistics for individual cities by moving your cursor over each city.
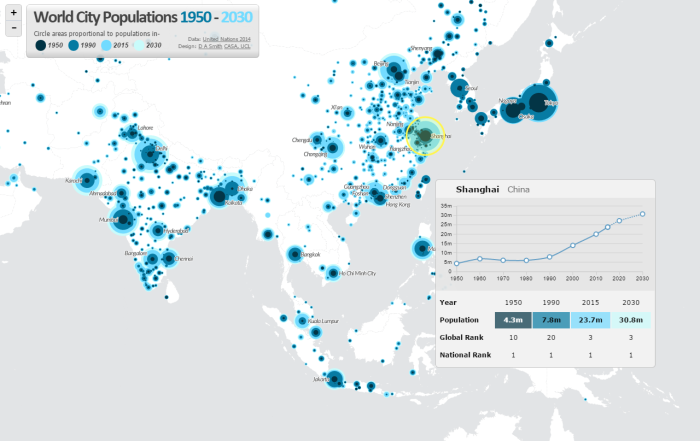
The site also includes queries of the city statistics, for example highlighting the world’s largest cities in different years. It’s amazing to see the dramatic changes between 1950 and 2015. London was the 3rd largest city in the world in 1950, and is now the 36th. In 1950 there were no African cities and only one Indian city in the world’s top 12, but by 2030 this list is dominated by Indian and African cities.

Mapping Tools Used
This map is the first time I’ve tried out CartoDB for interactive mapping, and I’m impressed with this tool. The main advantage of CartoDB for thematic mapping is the ability to perform SQL queries on the client-side, allowing map features to be highlighted interactively (this is used for the map queries on the World City site). There is also the ability to comprehensively restyle map symbology from the client using CartoCSS (this feature requires a full map refresh). Certainly sophisticated interactive mapping functionality is possible using CartoDB. It’s also Leaflet.js based, which is what I’m used to from the previous LuminoCity3D project.
Cities and Mega-City Regions
Measurements of city populations inevitably depend on where regional boundaries are defined, and the UN database is by no means perfect. The job of trying to integrate the hundreds of different city definitions used by each individual nation-state is no easy task. One of the interesting definitional issues that arises is around how very large polycentric regions have emerged in parts of the globe and beginning to look more like a single giant city. One of the most famous is the Pearl River Delta Megacity Region-
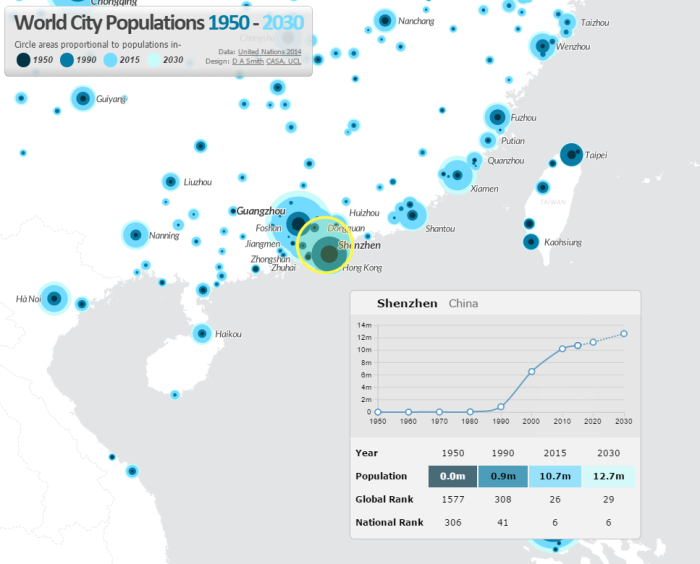
There are so many giant cities in close proximity that the map symbology struggles. Hong Kong, Guangzhou, Shenzhen, Foshan and Dongguan are all huge cities. Shenzhen in particular has experienced the most rapid growth of any city in history, growing from small town in 1980 to 10.7 million people in 2015. The combined population of these cities would make the Pearl River Delta the largest city in the world if a wider regional definition was employed.
![]()