
Fracturing Britain: the end of the United Kingdom?
Last year’s 2015 general election revealed a Britain that was increasingly fractured between nations, between the north and south of England, and between more prosperous metropolitan and deprived areas. But GE2015 has now proved to be only a staging post in the UK’s splintering. The momentous vote for Brexit in last week’s EU referendum threatens economic and political turmoil, and it may effectively split the United Kingdom.
The results show stark geographical divisions. Outside of London and its affluent hinterland, as well as inner cities such as Manchester, Liverpool and Bristol, England has voted for Brexit with a majority of 1.3 million (53% to 47%) voting to leave. Wales also voted for leaving the EU (despite being by far the highest UK beneficiary of EU funding) by 52.5% to 47.5%. Northern Ireland voted to remain by 56% to 44%, but is split between unionist and nationalist areas. Meanwhile Scotland has a strong majority to remain overall (62% to 48%), and a local majority to remain in every single local authority. The case for Scottish independence to prevent its undemocratic removal from the EU is inescapable, unless some kind of ‘reverse Greenland‘ compromise can be reached.


Underlying the geographical divisions are a host of socioeconomic factors, including education levels, income, unemployment and deprivation: in other words populations that have been cut off from the unequal benefits of globalisation have overwhelmingly voted out. The demographics of this outcome have been reviewed in detail in the Financial Times, or try the excellent John Harris reporting the UK’s inequalities. One of the saddest divisions in the referendum is age, with 75% of votes under 25 and 58% of voters aged 25-34 voting to stay in the EU. Young Brits are now set to have the opportunities of freely living, working, studying and cheaply travelling in the EU made much more difficult due to older generations.
The referendum came about as a Conservative manifesto commitment to address deep internal party divisions and appeal to right wing voters. This gamble has spectacularly backfired, forcing the prime minister to resign. However another critical factor in the result has been the Labour leadership’s mixed attitudes to remaining in the EU. Traditional Labour areas in England, including the North East (58% leave), Yorkshire and the Humber (58% leave) and West Midlands (59% leave) voted decisively to leave the EU. Labour’s uncharismatic leader Jeremy Corbyn has failed to make an impact during months of civil war by the Tory government, and ran a lacklustre campaign for remaining in the EU, despite the economic impacts of Brexit (currency devaluation, inflation, higher prices, more austerity…) set to hit poorest families hardest.
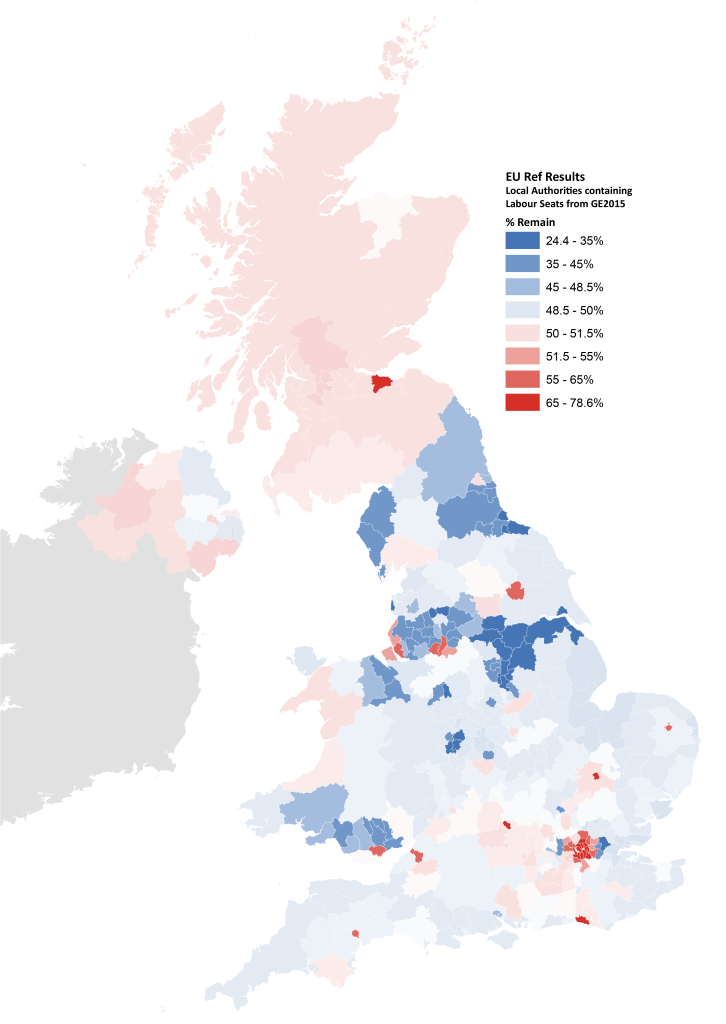
Another way to look at this is if we select local authorities that coincide with Labour won seats in the 2015 general election. We can see that there are a majority of Labour heartland areas that voted to leave the EU (51% of voters in the map below). Indeed if we discount London, the majority for leaving is 55%. This highlights the degree of disconnect between the remain campaign and Labour heartlands.
While the short term economic and political impacts of Brexit are already underway, the full implications will not be known for years both within the UK and beyond. During the referendum, the negative predictions of a Brexit were dismissed as scaremongering. We will now find out if this is the case, with jobs, the union, and the future of the UK and the EU on the line.
Get the data on the EU ref results- Electoral Commission, GIS File (thanks to @geotheory and @mappingmashups).
![]()