TubeHeartbeat


TubeHeartbeat visualises one of Transport for London’s most interesting and detailed open dataset, RODS. This has data on the approximate weekday volume of passengers between each pair of stations on the network, and entering/exiting the stations, at 15-minute intervals. Mapping this, as TubeHeartbeat does, shows a distinctive pulse, or heartbeat, as commuters surge in and out. There are locally interesting patterns too – a late night “palpitation” as the theatres close, early afternoon flutters as school kids get the tube home in suburbia, and double-morning rush hour peaks in parts of east London, perhaps showing the traditional blue-collar 8am start and the white-collar 9am start.
Click “Pause”, and then click on any station, or line between the stations, to see an interactive graph showing these ebbs and flows. You can also compare with an older RODS from 2012, to see where the commuter populations are rising (or otherwise).
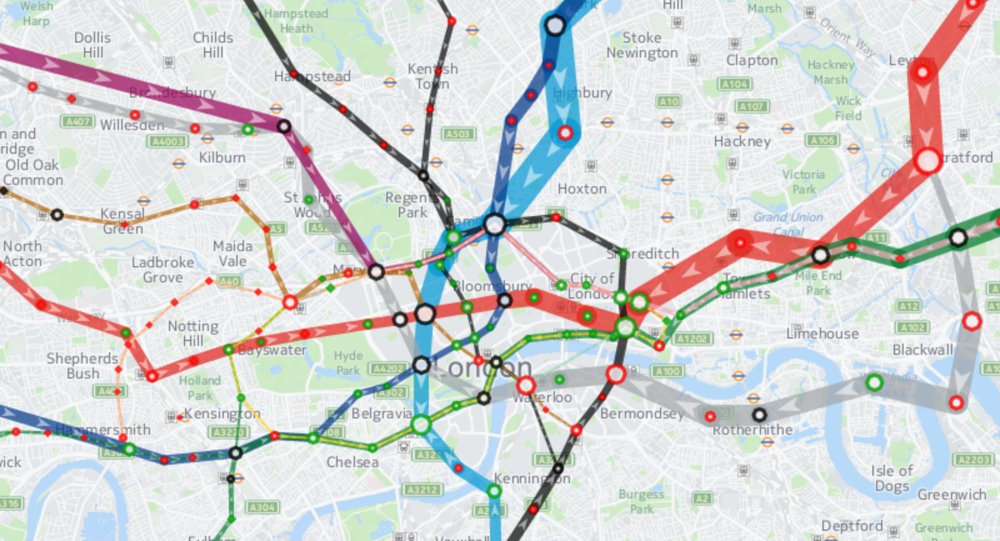
TubeHeartbeat is a commission for HERE Maps and uses the HERE JavaScript API to show the tube data, and the HERE Map Tile API for the pleasing background mapping. The HERE JavaScript API is optimised for showing data like this, resulting in fluid animation and navigation that should work well both on desktop and smartphone.
Try TubeHeartbeat or see further information about the project at http://oobrien.com/