
PPGIS 2017 – Poznan, Poland (Day 2) – Geodesign, applications and discussion
 The second day of the PPGIS 2017 symposium (see Day 1 here) started with a session on METHODS AND TOOLS. The session opened with a keynote from Peter Nijkamp (Vrije Universiteit Amsterdam, Amsterdam, Netherlands, Adam Mickiewicz University, Poznań, Poland) . The talk is titled “A big data dashboard architecture for computable intelligent city policy“.
  Peter noted that the way we talk about policy needs to differentiate between goals and implementations. From an early stage in his studies, he learned that when people come with ideas, there can be a whole list of goals for policy, and the tasks of the scientists is to consider how to implement it. In a linear system, the number of goals will be exactly the number of instruments which is an assumption of how to implement policy. In the Netherlands, they had a consultation about sustainable development led to over 65 goals but without any thought of implementation, and therefore the plan failed. Dreams have to be confronted with reality – the human capabilities to look at the multiplicity of goals is limited (e.g. the magical number of 7) – beyond 7 it is not possible to achieve goals. In a scientific system, you need to minimise things to lead to very few critical factors. Herbert Simon published a paper about the economics of complexity over 30 years ago – he uses the example of two watch repair people with one looking at all the details of the system and therefore failed, but the one that decomposes the system to sub-systems manage to complete the task in a more efficient way. The number of aspects in a planning system is limited, and there can be a highly complex system, it needs to be decomposed to few core sub-system (e.g. car dashboard as a demonstration). The view that is offering is a new urban world in which we need to notice all the challenges in an urban environment – connected city, climate adaptation etc. There are more and more discussions about smart cities over the past decade. We need to think what we mean by that – the European focus was on resources and quality of life. The core thing is about the use of ICT. The literature mixes input side and the output side. Smart Cities require decomposition – economy, people, governance, mobility etc. Naturaglly, there are different ranking for quality of life, green city – it’s all sort of indicators but these are not very helpful. Global City Power Index is probably the best of these axsand it’s from Japan. As the discussion about the smart city evolved, the Big Data challenges appeared – the question of how to organise them and manage them increased. Batty (2013) pointed that a city is not just a source of planning and activities, but also data. Are we going to find patterns in the data, or are we aiming to have a theory first. Nijkamp moved from just looking at the data, back to examine the theory and think what you would like to look at. This brings us to the C-I-TY Lab work. We need an evidence-based approach. Thinking about rational planning position about mission and position, and then take that into methodological aspects and operational aspects. The methodology is things like information cascade or hierarchical filters. The operational side is computable and numerical. The dashboard is a health check for a city or a region – are we still on course to achieve our goals. The dashboard is advisory and not a command and control system. The operational part of the city of Amsterdam, they look at job creation, regional and international export position, innovation and entrepreneurship, and geographic concentration. The idea is to compare to other cities and each bit also has comparison of previous years. In these systems, there are sub-systems and sub-sub-systems – focusing on each goal, but there is also an overall goal. The outcomes of the dashboard need to be interpreted within the wider ecological, social, and economic perspectives of the city – it requires expertise in interpretation. i-City is not only the digital power since putting it in the hand of untrained end users, will lead to a disaster. The system is assuming a stability in the planning of the goals and having long-term goals
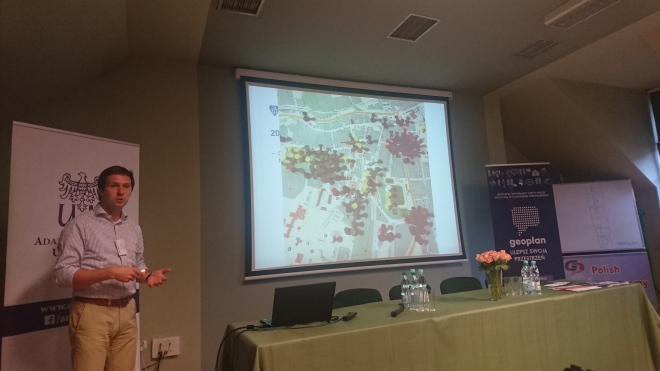 Mapping web-application for digital participation in urban planning Jiří Pánek (Palacký University Olomouc, Olomouc, Czech Republic) demonstrating a system that is being developed in Olomouc in the Czech Republic and allow a subjective layer of emotional mapping of the city on top of the mapping. He uses the concept from Perkins (2009) about the emotional understanding of space and place. Also using Griffin and McQuoid (2012) noticing maps of emotions, maps to collect emotional data, and finally emotions about using maps. They thought about biometric measurements – e.g. BioMapping, extraction of user-generated content but also surveys. While it is useful to understand that emotional maps can be relevant here, but he is also suggesting the concept of GeoParticipation (Panek 2014). This can be seen as a subgroup of PPGIS, but it is also part of Participatory Planning Support System. The approach depends on crowdsourcing, and alsobeen deployed across the Czech Republic through a network of small towns that promotes sustainability, working with over 40 cities. He covered the leaning from failure. Using an analogue way (just papers and pen) didn’t work in terms of expressiveness but it was difficult to map it with a pencil. Also going to only digital way, with just allowing people to draw point line, polygons. Also tried doing only points, because heatmaps produce wrong realisation about the city. Also trying just point end without knowledge of who collected the information. So they decided to collect points that are associated with a person and background and interest. They combine paper and digital maps, and in the paper maps they have numbered pins that allow you to write details about who collected the information and they also have a digital tool that ask for details that are recorded with demographic details at the end. In Olomouc, they’ve done 2117 respondents – paper 481 and web 1636. They focused on 6 spatial questions – including feeling of safeness, walkability etc – they received 25760 points/lines/polygons with 4801 comments. There is an age distribution that is skewed to the young age, with half of participants students. and they have 45% with university degree and more students. The results allow to identify 5-10 hot-spots to analyse further: the city needed simplified details that they can used. Associated comments to specific terms to summarised them. Some aspects of the analysis show focus of people in their local area, where they are happy to comments, while other aspects that they don’t want – both in my backyard and not in my backyard. Lessons: points are sufficient for most of the case studies. Critical mass is really crucial – thousands of participants are important. Active engagement with local authorities is a must: without a wish for participatory planning then there is no point in it. Analysis of the comments can bring further data. The system is www.pocitovemapy.cz.
 Geo-questionnaire – a tool to support the process of social participation Bogna Kietlińska (University of Warsaw, Warsaw, Poland), Robert Olszewski, Agnieszka Turek (Warsaw University of Technology, Warsaw, Poland) as a sociologist and art historian and collaborate with geographers and cartographers. Their geo-questionnaire include 154 participants and look at a recently revitalized street (Tumska street) and they wanted to explore the methodology. Plock is an old city, with a population of 126,000 and a university city with a lot of young people. The biggest problem on the street is that there are many obstacles that make the street difficult to navigate – it’s mostly shopping and services street and there are social problems: council flats, homelessness and lack of trust regarding the area. in Poland there are only 30% there is lack of spatial plans, and very little trust with other people (only 20%). They looking at open geoinformation, VGI, spatial data mining, text mining and working as a group that cut through science, art, and business. The questionnaire is providing something concrete to answer, allowing people to geolocate answers and make them less abstract, and it is suitable for participation in spatial planning. People could mark things that they like and dislike and also open questions to allow qualitative answers. People below 25 liked the street, people between 25-65 had mixed opinion, and older people completely didn’t like the changes at all. The limitations of the questionnaire are the issue of internet access and ability to use them and financial access – and therefore thinking about representativeness. there is also an issue that this is static – not taking into account our body in space. Her view is coming from the phenomenology of perception, and sensuous geography and urban sociology. Therefore need to an embodiment of experience and meaning. Emplacement creates certain association and understanding. We can think of ethnographic methods (walks and observations), design thinking with prototyping, gamification with storytelling in virtual reality. There is also thinking what storytelling. Also considering multi-agent systems and fuzzy modelling. The gamification they think about the playable city and creating prototypes for getting points for different contributions. Also created certain monsters: such as architect who don’t know how to create proper building that the participants need to work with. They are also considering an agent-based model of the city and also consider fuzzy logic model. They work in three places – they work with Warsaw “Mordor” to address traffic jam and gamification. Addressing the right questions within the system and understanding participants in order to be able to assess all the answers in a more qualitative and analytical way.
The Geo-Citizen participation framework: 15 years research, 3 years implementation – now serving societies worldwide Thomas Blaschke (University of Salzburg, Salzburg, Austria) In Salzburg, they’ve been doing all sort of projects from 1998, Thomas worked in different places in Africa: Mozambique and elsewhere. Also one of their researchers moved to Quito in Ecuador and set out many activities. The GeoCitizen framework is now well established and they are offering services in a company that was established about a year and a half ago from the university. They are offering services to small towns. There is also work of the quality of life and well-being is always relative to persons expectations and experiences. Collaborating with environmental psychologist to explore different aspects.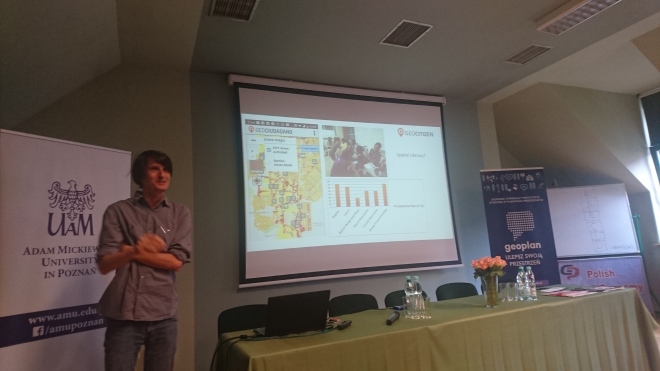
Karl focused on the geocitizen. The work is linked to Domingo Anjuasg of the Shuar Nationality from the Ecuadorian Amazon who received an award in the Amazon GIS initiative that was noted in last year Esri user conference. This is done with Richard Resl. The technology of GIS is being used to be visible: because of competition over resources in an area. Richard was asked, 25 years ago, to teach the Shuar on how to create maps. There is a need to reach out to the world. Domingo also wanted to communicate their life plans to the world. The pilot of the Geocitizen was to allow people to discuss how they want to use their territory and how it should be used by people. This led to other cases in a more urban environment such as participatory infrastructure planning for Quito. They’ve done usability studies with marginalised communities to test the system, in Cali, Colombia – working with black communities with people without higher education and ask them to carry out some tasks – mapping tasks are difficult but other familiar tasks from the use of social media was familiar. There is need to know that spatial literacy is a major obstacle. They are considering how to implement serious games as a way to help people understand spatial information. An anecdote from their experience is that when surveyors carry out their work, people who were aiming to rob them of their tablets, turned into respondents once they understood what is it for. Interestingly they brought the methodology back to Austria and using it in a village. the basic concept is from local to multiple case studies. There is also organisational design: having a local leader and facilitators. They are using multiple skills: facilitators, people who are helping in understanding the GIS data, or to work with social media – training people and keeping them motivated. More lessons: neighbourhood scale, and focus on ideas and no complaints. Keep the tool simple but structured, Use local knowledge and transfer it and integrate tools, methods and stakeholders to make things integrated.
The second session was focusing COLLABORATIVE DESIGN
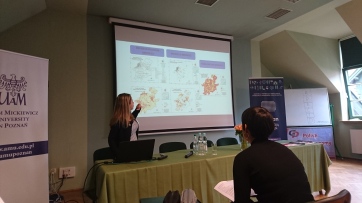 Interoperability and visualization as a support for mental maps to face differences in scale in Brazilian Geodesign processes Ana Clara Mourao Moura (Federal University of Minas Gerais, Belo Horizonte, Brazil) presenting for Camila Zynger on the Geodesign is Pampulha in Brazil – it’s an area that Oscar Niemeter started – it’s an area that is becoming famous but also there are challenges because of that. They use the framework of Geodesign, using a framework my Michalle Campagna helped with the process. They follow the process through different models and they’ve iterated through the process 3 times – first finding the basic information and running the model twice so they can ensure that it is done probably. They started with representation models in the first iteration. Significant work was required to create the data for example, in vegetation maps. They’ve classified maps to vulnerability and attractiveness – they included stakeholders representing developers, business, environmental NGOs and which were represented by different university expert. The first iteration didn’t yield useful results. In the 2nd iteration, an effort on youtube was dedicated to recruiting relevant people with local knowledge and in the third iteration they’ve used more printed maps – just using computers alone wasn’t working. As soon as people went to the computer, they left the paper, but this took 40 minutes of working with paper. They created a set of paper maps. The process included a lot of talking about the process and although peopel complained a lot about variables, maps etc. Actually, people wanted just three main variables. They went from Symbology can be more difficult and from using traffic light: that can be confusing and misinterpreted. They have also learned of the need to have focused question for discussion in terms of their outcome. The main contribution of the experiment was to build different futures for the place, to arrive at more specific question that will be put out for a discussion, but also in educating people with the implications of their choices. People understood things that they haven’t understood before.
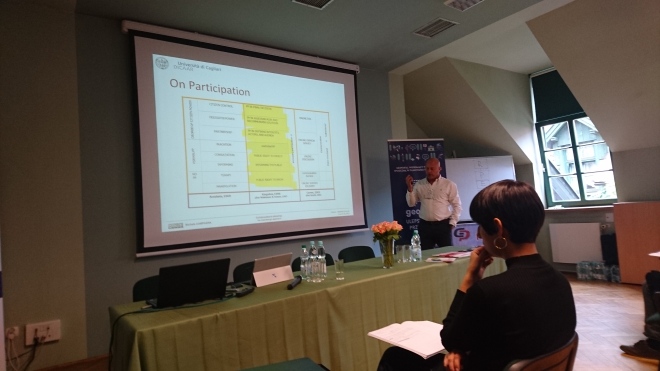 Collaboration in planning: the Geodesign approach Michele Campagna, Chiara Cocco (University of Cagliari, Cagliari, Italy) the software for a new planning support system, it is important and helps in explaining the concepts beyond that. Starting from Arnstein 1969 ladder, other models started to emerge specifically for technology – specifically Kingston 1998 and Carver in 2001. In particular Kingston model focusing participation in interest and agenda, assessing risk and making a decision. In public participation we need to thinks about groups – participants, communities, NGOs, and in participatory planning the planner role has changed: the role of an expert that is also act as a coordinator. The case that they discussed running a geodesign case of Cagliari metro area in Sardinia. They have a municipal plans, but also a need to collaborate with other nearby municipalities (17 of them) and they don’t have the culture of participation. They carried out a workshop over 2 days. They have thought about a forecast of 20 years ahead and thought about 10 possible areas of different systems and aspects. They’ve started from an analysis of regulations and plans and that allowed them to set those systems that will be the focus of the study. They split systems to aspects that they want to protect (e.g. ecology) and develop (e.g. smart industries). They carried out systems impacts model. They also integrated this cost models. The workshop gave training to about 30 people from the university but also professionals from across the area – they played the roles of different stakeholders. The workshop provide a good connection to allow heavy interactions. They also created a paper booklet. Asked the participants to work as experts group on each area of the 10 area. People were also set to different groups – and then started to create synthesis and measured some of the impacts and measured visually the impacts of the proposed changes – positive and negatives. They also analysed the compatibility between groups and started negotiations and evaluating different models. Carried out two synthesis and the final discussion was more tensions, and then they’ve ended with an agreed model. Planners, public administration, stakeholder and community members demonstrate that they can provide an input in different stages. The synthesis require the widest participation
 Geodesign in Pampulha cultural and heritage urban area: visualization tools to orchestrate urban growth and dynamic transformations Ana Clara Mourao Moura (Federal University of Minas Gerais, Belo Horizonte, Brazil) This talk focus on a place where there is a historical place – cultural heritage in Quadrilatero Ferrifero – it’s an important place with urban growth, mining, cultural heritage and the beginning of the Brazilian culture. They were influenced by McHarg and Steinitz works. They created representation models and again need to produce data over two months. They’ve done that with 10 researchers from the federal university. This allows them to move to process models and evaluation model. They used existing and three levels of green for acceptable and yellow for not appropriate. They started evaluating alternatives. They had 6 teams including people from communities,
  NGOs, and they’ve set out groups that focus on change and another group that focuses on conservation. They discussed the different options. People were not linking reality to the maps and where more interacting with the system – people didn’t understand where they locate the diagrams and their meaning. To address that, they need to link reality and digital representation – used 3D visualisation and relied on Bishr 1998 and allow interoperability with other systems and then could create different visualisations. That allow new ways of understanding the designs. By having a 3D representation people could use maps better and deal with scale problems. Conclusions: geodesign is about alternative futures, and we need to share decisions and we need communication between people and between machines. We need to deal with reality, mental maps and digital representation.
First Life. A geo-social network to support participation in urban design Alessia Calafiore, Lucia Lupi (Univeristy of Torino, Torino, Italy) Firstlife is a geo-social network to support participation in urban design and cities, It is about collecting georeferenced systems – places, groups, news and events and think about relationships among them and on a temporal scale. The map allows filtering by time or by groups. – There are multiple point-of-views – a school can be viewed from students, parents, teachers. Although they’ve started with points of interest, they now dealing with building blocks of the base-map – such as selecting the whole building and trying to deal with the geometry according to the scale. The platform is addressing different aspects and objectives: from issues such as regeneration. In that area, they collect data to document projects and initiatives and to follow-up and continuity. They try a project with 6 municipalities, 30 schools, 60 teachers and 70 classes. The project started with planning activities, they design the decision about the guidelines for mapping activities and then collecting information with proposals about sites for regeneration. Workshops were carried out with a different group and they had a problem with students you need to deal with the topic, and with teachers, you need to train on the use of the platforms. They used the process itself and mapped it in FirstLIfe (such as recording where training happened). The tours allow participants to select potential locations for regeneration. There are also focus group events to ensure that offline event are recorded and shared on the system. The follow up is to select proposals for recommendations on regeneration. The information is at regeneration.firstlife.org
 Social participation in determining air quality in agglomerations. Beata Jasiewicz, Jarosław Jasiewicz, Waldemar Ratajczak, Alfred Stach, Maciej Stroiński (Adam Mickiewicz University, Poznań, Poland) collaboration between chemistry, and geosciences. The case in Poznan – city is not about the physical space but also for people. Air quality is of growing awareness in Poland – in Cracow, Poznan and other places. It is becoming an important political issue. There are also penalties for municipalities that are ignoring smog. There 300 alarms of passing the limits of PM10 300 times which is amongst the highest in Europe. There is a concentration of PM10/PM2.5 in Poznan and NO2 across the city with 18 exceedances a year and light on the side of SO2. There are many issues that affect the legal efficiency of addressing air quality at the regional level. There is a continued interest in air quality – in internet queries they see questions about NOx. However, some specialised terms are less searched online by the public: e.g. PM10 became a search term only in 2017, and other term are not searched at all. In Poznan got only 4 monitoring stations with only 2 continuous monitoring – people want to see warning being communicated to them. From the political point of view, the protection of the environment is centralised in the Ministry of Environmental Protection with state councils on nature conservation and another one of environment protection (experts in different areas). Also have general inspect of environment protection. They have a provincial governor (Voivode) who also have provincial inspect of environmental protection and other systems that are similar to the national system. At the provincial level, there are different mechanisms: public consultations, linking to NGOs, Public independent initiatives, and of course citizen independent actions and protest – but they also have independent citizens budget. At the city they have the city council and the mayor who have environmental functions. The regional council also have environmental functions with a provincial fund for environmental protection. Offering new ideas require negotiating with lots of organisation. They try to address the problem through Public Independent initiative at the city level – with the mayor and city council. To do that, They look at the opportunity of smart and digital city and consider sensors of air quality. Also what to consider forecasting of the conditions through emission data, topographical data and weather data. They started doing simulations of pollutants dispersion in the city and also consider modelling air movement in the street. They are now consider applications and services that will help people plan where they should go and for outdoor activities. They already go system that involved communities in Krakow, Wroclaw, and also looked at other systems.
The afternoon session focus on APPLICATION CASE STUDIES
Applications of Geoweb Methods in Urban Planning on the Examples of Selected Polish Cities Edyta Bąkowska, Marek Młodkowski, Łukasz Mikuła (Adam Mickiewicz University, Poznań, Poland) Edyta project aim to support public participation in urban planning and they notice that in the development in Poland the collecting proposal at the beginning of the proposal and in collecting opinions in the draft stage of the plan. 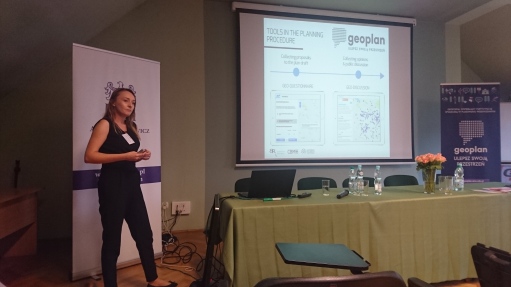 This includes a public presentation of the plan, public discussion, and formal motions for alterations. This last 3 weeks. There are especially developing a geo-questionnaire tool to collect proposals, and a geo-discussion tool to collect opinions and public discussion. In the project, they’ve done 10 public consultation processes – 6 with geo-questionnaire, and 4 that include both tools. They so far had 7500 active participants and further 97 participants in 2 geo-discussion. The cases are in the Poznan agglomeration. The cases include land use plans, urban design and urban renewal, transportation, quality of life diagnosis. The area could be as small as 1 ha to 200,000 ha. In Rokietnica they had an interesting case – a fast growing area, doubling in people over 10 years. They prepare a demographic forecast that expected to double in size, and at the centre, there is a site of 16 ha that is derelict. They’ve used a structured process and carried out the questionnaire in December 2015, and the geo-discussion in May/June 2017. The process is a long one, in terms of transferring land-use plan to the system. The geo-questionnaire 435 participants, about 3.3% of the resident in the village with over-representation of 25-45. In the geo-discussion, 65 people participated, with 131 discussions and 51% are in the 25-34 age range. The planning result is that views from the geo-questionnaire have influenced the planning, but the planners decided to put in multi-family buildings while the participants suggested single family houses. Strong opinions about the suggested density were expressed in the geo-discussion. We need legal regulations to use tools but also to support their information – there is still too much of a check box attitude. There are problems with the use of information from participatory processes in action. What do we need http://geoplan.amu.edu.pl/
 An Integrated Approach to Public Participation in Urban Planning with Geoweb Methods Michał Czepkiewicz (Adam Mickiewicz University in Poznań, Poznań, Poland; University of Iceland, Iceland), Piotr Jankowski (San Diego State University, San Diego, USA; Adam Mickiewicz University in Poznań, Poznań, Poland), Cezary Brudka (Poznań University of Economics and Business, Poznań, Poland) Cezary explored the ability to thinks about the urban planning phases and supporting the designers in what they need to integrate the tools into the process of urban planning. They are building on EAST” from Jankowski 2011.


They see the socio-institutional context of the participatory process, considering the participants and the technology: design consideration. They proposed several dimensions – include which planning approach is used – the use Kahila-Tani 2015 concepts of planner-centred and restricted information premise, so try to move towards more collaborative planning. They see the need to consider the diagnosis of the current situation. They identify the tools can match knowledge and flow of knowledge between participants – e.g. geo-questionnaire that provide information from participant to the convener, but not support communication between participants. They also pay attention to the linkage and transfer of information – is it about just informing? is it about fuller communication? There are cases that feedback is not even captured with the tool. They have a case of a bottom-up approach by an NGO in Poznan and it is mostly about initiation – generating ideas about what the city needs to do. Using geo-questionnaire provide one-way communication but then a step of sharing information. In another case, they elicit local knowledge and preferences. We can also think about other stages, so as the need to inform the public about the plan. In the Polish case, they need to move from the rationalistic planning focus toward communicative and evidence based.
 Volunteered Geographic Information for planning: the case for „emergent” cycle lanes in Cities Antonello Romano, Stefano Picascia (University of Siena, Siena, Italy) Stefano looking at ways of integrating VGI into the planning process. They are looking at VGI and assuming wisdom of crowds, and specifically looking at Strava data that is coming from bicycle users. The data are sold for profit – a wealth of data that can be useful. They explore the options of using this data to help planning of cycle routes – identifying routes where a high number of trips are taken. Arguably the network is emerging from multiple cyclists – also need to consider why these routes emerge. To understand the data there is a need to use infrastructure data such as planning cycling network, but also need to combine topography, information about incidents and accidents and other bits of information to be able to explain the patterns. Trips that are on the cycling network and those that outside help to reveal the usability of the current cycling network. For example, roundabouts and places where the cycle network do not continue. Some ideas in Rome do not match the data and there are questions if we should use Strava data. There are problems with this data: data quality and accuracy, demographic profile, price, ethics. Elderly cyclists don’t use apps. There is an issue of data that is valuable for society, but companies are locked by the company and you can’t gain access to it.
The final part of the workshop was structured discussion around seven points:
first, understanding ICT by people belonging to different groups – concern about digital exclusion? The first point, there is an increasing engagement with technology, but because of the persistence of the age distribution we seem to have an issue with people at an older age, and therefore need to have strategies for inclusion. Another participant pointed about collaboration between millennials and older people as one way to address this. On the other hand, pointed that older groups to acquire and learn are lower than younger people so need to consider how AI assistant will be involved. Where we are right now, we need to be aware of the ever-changing technology need to consider how it may be narrow with future technology. There are natural problems. There are also about issues and sometimes the issue is the one that leads to certain focus.
Secondly, experiences concerning to legal regulations in the context of participation: in urban planning, there are regulations in Italy that open the option but don’t mandate it. Need to be aware of implications to different bodies. In Ireland, data protection and ownership are coming as a major concern for organisations about what is collected and where. In Brazil, there is a law that requires participation in planning, but what type of participation and which level of participation is not being set. In the USA, there is a very much federal system that allows independent bodies to collaborate – counties do have a lot of power, and cities do their own planning. Based on the ideas of federalism they do things their own way. Some cities are more participatory due to their culture, while other are not trying to engage people. Poland seeing growth in soft informal planning – pre-planning process that open opportunities for planning.
Third, what are necessary conditions for cooperation between city planners and public participation representatives – in Italy it is impacted by the wider atmosphere, with planners being limited by the current politics and guidance. In the Polish system, the city planners are also limited within their focus and remit – they are not asked to do public participation. Other experiences in Poland point that planners have specific needs for information and it requires a top-down process to allow for public participation. There is a need for a process that allows for symmetric information exchange. In Brazil, they want to be the authors of the designers of the city and they somewhat resist to be the decoder of collective values. There are also restrictions in terms of the role and what is expected from the private or the public planner. For example, if the private planner office does not want to expose the information to the public, the public planner is limited in what they can do. There are situations in which the public and private actors should work together to engage the public.
The fourth, point looked at popularity of new methods, this is different in locations according to their legal and organisational structures.
Fifth, the role of social movements in shaping of liveability in cities. Social movement make problems visible and showing problems – but they then require the experts to be involved in setting it out. They have a role to highlight issue, and because planning and city management is longer time scale, the relationships are more complex.
Sixth, regarding new methods and tools that will be most useful: visualisation is important for communication. Techniques (e.g. Space Syntax) also old tools of sketching and also existing methodologies. Augmented Reality. DIY science and data collection will come along, and in social science there are questions about using existing data sets and collaborating systems and the used of stuff that is already out there.
Finally, also the issues of linkage between information from participatory methods and tools and choices made by decision makers – and constraints on the use of information accessible and usable. Getting access to data is a problem inside organisations and sometimes there can be changing the way people structure processes. Also, wide scale political processes and general atmosphere communicate to the public and the planners if the is more scope for participation and if it will take in seriously or not.

![]()