
Spatial Strategies
PGRG Blog #8, December 2017

Spatial Strategies Supporting Complex Human Systems: A Health and Aged Care Case Study
By Dr Hamish Robertson
Introduction
In the 21st century population ageing represents a very complex ‘problem’ with which various human systems (political, economic, health) continue to grapple. The geography of ageing is dynamic and the epidemiological complexity of various groups of older people is growing (e.g. complex comorbidities, neurodegenerative diseases). Even now current typologies of the aged (younger old, older old, oldest old etc.) do not capture the full scope of what is emerging as we progress towards the realisation of living in aged societies. This short piece addresses how a geographic perspective may help better inform systemic responses to this profound demographic change.
The Australian Context
This research focuses on the state of New South Wales, looking at the connections between demography, epidemiology, geography, health service infrastructure and the costs of formal care provision under projected conditions of population ageing. This included three different disease projection scenarios to allow for changes in context and effects across geography.
New South Wales is a very large administrative area of some 900,000 square kilometres with an extremely uneven population distribution – heavily weighted towards the eastern seaboard. Many of the public, private and charitable service providers that do exist are situated for reasons of historical urban and regional development, rather than any rational planning processes. As such demand does not closely match service distribution and some health and aged care services are much more accessible than others. These are usually more general in nature such as family doctors and pharmacists.
However, population ageing, its epidemiological correlates and corresponding health and care needs often require more expert knowledge and skills than the existing service distribution pattern currently provides. Not only does this raise issues of timely access and quality of care but the need for better planning and analysis. This is, I believe, where a geographic perspective can inform health and aged care responses at multiple levels.
Stage 1: The Dementias and Alzheimer’s Disease
Stage one of the work connected projected population ageing to the issue of Alzheimer’s disease (AD) prevalence, an issue still poorly understood at the sub-national level, and even more so at the regional and local levels. From the start this approach was connected through locational geography. This meant each stage of the analysis (basic prevalence, annualised incidence, dementia sub-types and likely severity, were all indexed to the SA2 administrative geography. This was the lowest level at which the Australian Bureau of Statistics had released its publicly available age and sex population projections (2012-2027).

Stage 2: Spatial Analysis
The second stage involved a geographic information systems analysis using the Maptitude software for Australia. This included mapping the data above but also major health and aged care providers types: public acute care hospitals; family doctors; aged care assessment teams (ACATS); ambulance stations (often the first responders to older people with confusion, falls etc.); pharmacies; government-approved nursing home providers; and, lastly, meals on wheels, a publicly supported homecare service often accessed by older people needing support while living in the community. This produced a wide range of outputs (almost too much for one thesis) including the ability to analyse the spatial relationships between the at-risk population of AD patients and existing aged care service providers. The logic here was to provide a platform for identifying service gaps, emerging high need locations and to be able to explore the discontinuities in our existing service arrangements. The map below shows the overlay (only) of modelled AD prevalence for 2027 and existing facility doctor distribution.
Map of GP distribution and projected 2027 Alzheimer’s population in NSW: Sydney Metro

Stage 3: Data Visualisation
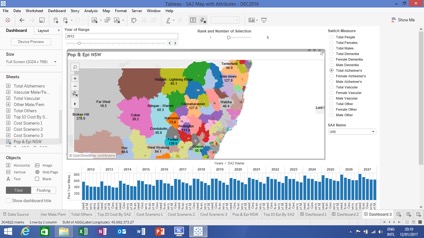
Lastly, because geography and GIS remain poorly understood in many aged care environments, I transferred the data to a data visualisation environment in an effort to improve understanding by and engagement with health and aged care service providers. This was done using the Tableau software. One of the dashboards, example below, shows how the geography of AD at the SA2 level can be mapped and the prevalence visualised including sub-types by sex, for the whole state and within the one visual. Each option is ‘live’, meaning the user can inquire on any of the groups and SA2’s. This is supported by the time-lined bar chart along the bottom of the dashboard and the ability to select each of the modelled years using the top left Year of Range option.
Population and epidemiology dashboard for New South Wales – state level image
Conclusion
The idea of integrating GIS analyses into a data visualisation package has been well-received in ways that, in my experience, conventional GIS mapping alone has not. Obviously (to this audience), GIS and data visualisation are highly compatible strategies that share a variety of basic concepts (e.g. mapping, data intensification, visual communication). This situation will almost certainly continue to intensify as technical progress in both these fields occurs. At the core of this project, though, has been the premise that geography can contribute to the work of many other disciplines and professional domains of practice. And it does so in ways that are unique to geography’s understanding of those complexities I mentioned in the introduction.
Author
Hamish Robertson completed his doctorate on “The Geography of Alzheimer’s Disease in New South Wales” in 2017. He has 20 years’ experience in health and ageing research. Currently he is a Research Fellow at the University of Technology Sydney, Australia, managing a project on Visualising Vulnerabilities in healthcare environments. He is attending the AAG 2018 conference in New Orleans and is happy to chat further there!

![]()