
Citizen Science & Scientific Crowdsourcing – week 3 – Participation inequality
One of the aspects that fascinates me about the nature of participation in citizen science and crowdsourcing is the nature of participation and in particular participation inequality. As I’ve noted last week, when you look at large scale systems, you expected to see it in them (so Google Local Guides is exhibiting 95:5:0.005 ratio).
I knew that this phenomenon has been observed many times in Massive Online Open Courses (MOOCs) so I expected it to happen in the course. I’m particularly interested in the question of the dynamic aspect of participation inequality: for example, at the point of the beginning of the “introduction to citizen science and scientific crowdsourcing” course, every single person is at exactly the same level of participation – 0. However, within three weeks, we are starting to see the pattern emerges. Here are some of the numbers:
At this point in time, there are 497 people that went through the trouble of accessing UCLeXtend and creating a profile. They are a small group of the people that seen the blog post (about 1,100) or the tweet about it (about 600 likes, retweets or clicking on the link). There are further 400 people that filled in the online form that I set before the course was open and stated their interest in it.
The course is structured as a set of lectures, each of them broken into segments of 10 minutes each, and although the annotated slides are available and it is likely that many people prefer them over listening to a PowerPoint video (it’s better in class!), the rate of viewing of the videos gives an indication of engagement.
Here are our viewing statistics for now:
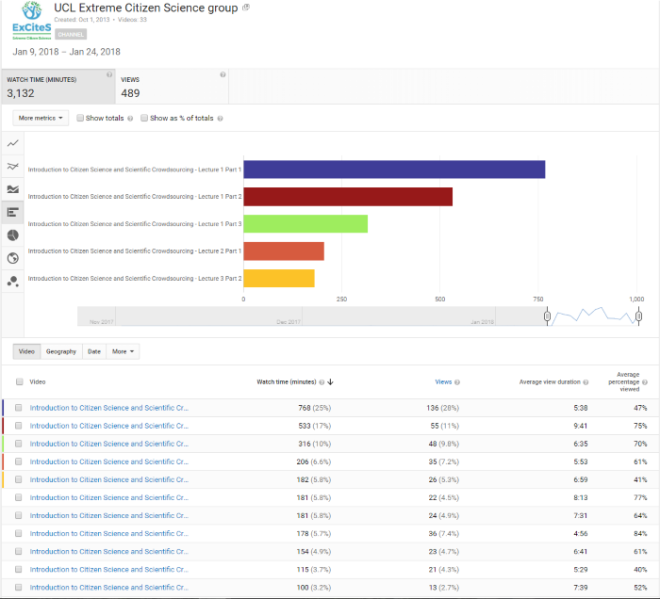
We can start seeing how the sub-tasks (viewing a series of videos) is already creating the inequality – lots of people watch part of the first video, and either give up (maybe switching to the notes) or leaving it to another time. By part 4 of the first lecture, we are already at very few views (the “Lecture 3 Part 2” video is the one that I’ve integrated in the previous blog post).
What is interesting to see is how fast participation inequality emerges within the online course, and notice that there is now a core of about 5-10 people (about 1% to 2%) that are following the course at the same rate as the 9 students who are in the face to face class. I expect people to also follow the course over a longer period of time, so I wouldn’t read too much into the pattern and wait until the end of the course and a bit after it to do a full analysis.
When I was considering setting up the course as a hybrid online/offline, I was expecting this, since the amount of time that is required to follow up the course is nearly 4-5 hours a week – something reasonable for an MSc student during a course, but tough for a distance learner (I have a huge appreciation to these 10 people that are following!).