
From environmental management to organisational strategy development: Using Drivers-Pressure-State-Impact-Response with ECSA
This week, together with Margaret Gold, I facilitated a strategy meeting of the European Citizen Science Association.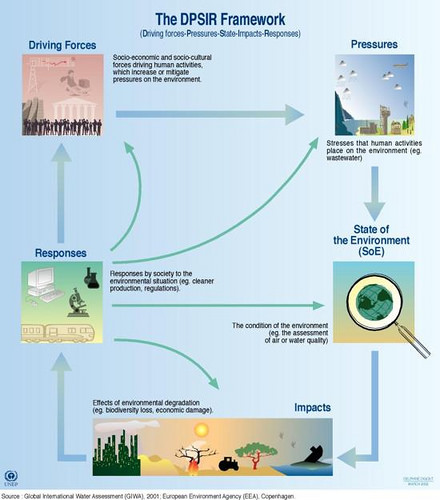 At the moment, because a recent lecture in the Introduction to Citizen Science and Scientific Crowdsourcing course that was dedicated to environmental citizen science, the “Driving forces-Pressures-State-Impacts -Responses” (DPSIR) is in the front of my mind. In addition, next week I’ll participate in a workshop about Long-Term Socio-Ecological Research (LTSER) where I would discuss citizen science in another context where DPSIR is a common framework.
However, if you are not familiar with large-scale environmental management, where it is widely used since the mid-1990s, you’re not expected to know about it. It got its critics, but continue to be considered as an important policy tool. DPSIR start by thinking about driving forces – trends or mega-trends that are influencing the ecosystem that you’re looking at. The drivers lead to specific pressures, for example, pollution or habitat fragmentation. To understand the pressures, we need to monitor and understand the state of the system – this is lots of time where citizen science and sensing data are used. Next, we can understand the potential impacts and then think of policy responses. So far, hopefully clear? You can read more about DPSIR here.
I haven’t come across the use of DPSIR outside the environmental area (but maybe there is?). However, as I was thinking about it, as we prepared for the meeting, I suggested that we give it a go as a way to consider strategic actions and work for ECSA. It turns out that DPSIR is a very good tool for organisational development! It allowed us to have a 20 minutes session in which we could think about external trends, and then translate them into a concrete action. Here is an example (made up, of course, I can’t disclose details from a facilitated meeting…). I’m marking positive things, from the point of view of the organisation, as (+) and negative as (-).
Let’s think of a citizen science coordination society (CitScCoSo). in terms of drivers, an example will be “increase recognition of citizen science”, as Google Trends chart shows. Next, there are the pressures which include (-) the growth in other organisations that are dedicated to citizen science and compete with CitScCoSo, which mean that it will need to work harder to maintain its position, (+) increase in requests to participate in activities, projects, meetings, talks etc which will create opportunity to raise profile and recognition. CitScCoSo current state can be that the organisation is funded for 5 more years and have a little spare capacity for other activities. The impacts can be (+) more opportunities for research funding and collaborations or, (-) demand for more office space for CitScCoSo (-) lack of IT infrastructure for internal organisational processes. Finally, all this analysis can help CitScCoSo in response – securing funding for more employees or a plan for growth.
When you do that on a flipchart with 5 columns for the DPSIR element, it becomes a rapid and creative process for people to work through.
As I pointed, a short exercise with ECSA board showed that this can work, and I hope that the outcomes are helpful to the organisation. I will be interested to hear if anyone else know of alternative applications of DPSIR…