

Data-Driven Urban Dynamics at ORNL
Visited the Urban Dynamics Institute (UDI) headed up Budhendra Bhaduri (Budhu) which is a rapidly growing effort in data-driven technologies applicable to cities. This group which is based at Oakridge National Labs which began life in the war years as part of the Manhattan Project, focusses on research that is geared to understanding, predicting and resolving key urban problems using large data sets which are spatially extensive. It is one of the few groups around the world doing serious research into the science of cities, albeit data-driven in that the focus is on extracting urban patterns and processes from very large data sets. Traditionally these data sets have been based on imaging from remotely sensed data but are now being extended to social media and all kinds of real-time sensed data dealing with location, mobility, transportation and climate. Many of these projects utilise the powerful computer technologies established at Oak Ridge by the Department of Energy that runs the National Labs. At Oak Ridge, the UDI used the TITAN supercomputer for processing remotely sensed images that require various forms of deep learning in the extraction of pattern. TITAN is the fourth largest supercomputer worldwide (measured by petaflops – floating point operations per second which is greater than 10pb) but it is being replaced by SUMMIT and the lab could well take the top spot, overtaking China again – who knows.
The UDI’s most visible project is Landscan. This is a world-wide data set at very high resolutions – at various grains down to approximately 1 km resolution (30″ X 30″). let me quote from the web page: ” LandScan is the finest resolution global population distribution data available and represents an ambient population (average over 24 hours). The LandScan algorithm, an R&D 100 Award Winner, uses spatial data and imagery analysis technologies and a multi-variable dasymetric modeling approach to disaggregate census counts within an administrative boundary. Since no single population distribution model can account for the differences in spatial data availability, quality, scale, and accuracy as well as the differences in cultural settlement practices, LandScan population distribution models are tailored to match the data conditions and geographical nature of each individual country and region.”
I am a member of the Scientific Advisory Board [myself, Mike Goodchild (UCSB), John Harbor (Purdue), Nigel Davis (Willis), Karen Seto (Yale), and Luc Vincent (Lyft) were in attendance] and we visited Oak Ridge last week March 27-29 and I gave a talk to the Institute. Bhudu asked me to talk on Cities and AI and although I complained mildly that I didnt know much about AI, I have explored how neural nets can be used in models of design so I decided to talk about this. You can access and read my talk by clicking on this link that will give you the PDF
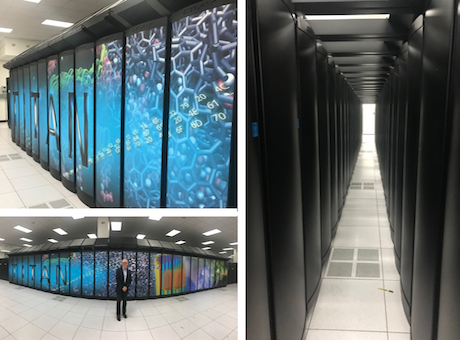
However the icing on the cake was a visit to see TITAN and the photographs above show a panorama of me along the bank of boxes which are thence arrayed in parallel in 8 rows, a truly massive machine. Also saw one like this at Harwell (Rutherford-Appleton) the other week at STFC !