World City Living and Working Densities: Poles Apart?
One of the most recognisable visualisation techniques used by LSE Cities in the Urban Age publications is the 3D density map- an intuitive and engaging way to represent built form, and enable comparison of very different city environments across the globe. I’ve been producing 3D density maps in my own research for around five years now, and so it was a nice challenge to produce the 3D density maps for this year’s Urban Age conference, the Electric City in London. In this post I focus on the contrasting densities in three leading world cities- London, New York and Hong Kong- with the added twist that both residential and employment densities are mapped for comparison.
Higher urban densities can facilitate more sustainable travel patterns, improve service delivery efficiency, reduce building energy use and promote urban vitality. These advantages depend of course on good urban planning to minimise congestion and pollution problems. High density mixed-use development is central to the compact city planning movement, and remains a foundation of sustainable planning policy today. Here we map the number of residents in each square kilometre of a 100 by 100 kilometre region for London, New York and Hong Kong. Lower urban densities apply to suburban-like neighbourhoods, while high densities generally represent medium or high rise buildings clustered on a tight urban grid.
The city that stands out in the mapping is Hong Kong, with its extremely high residential densities exceeding 110,000 people per km2. Here planners have responded to scarce land availability with very tall (over 30 storeys) high-density development. Scarce land has also influenced the development of New York City, where Manhattan densities peak at 59,000 people per km2. London in comparison is much lower density. The heritage of suburban housing and generous greenspace has created a residential culture at half the density of New York and a quarter the density of Hong Kong. Despite current intensification in London, residential densities remain a world away from other global cities.
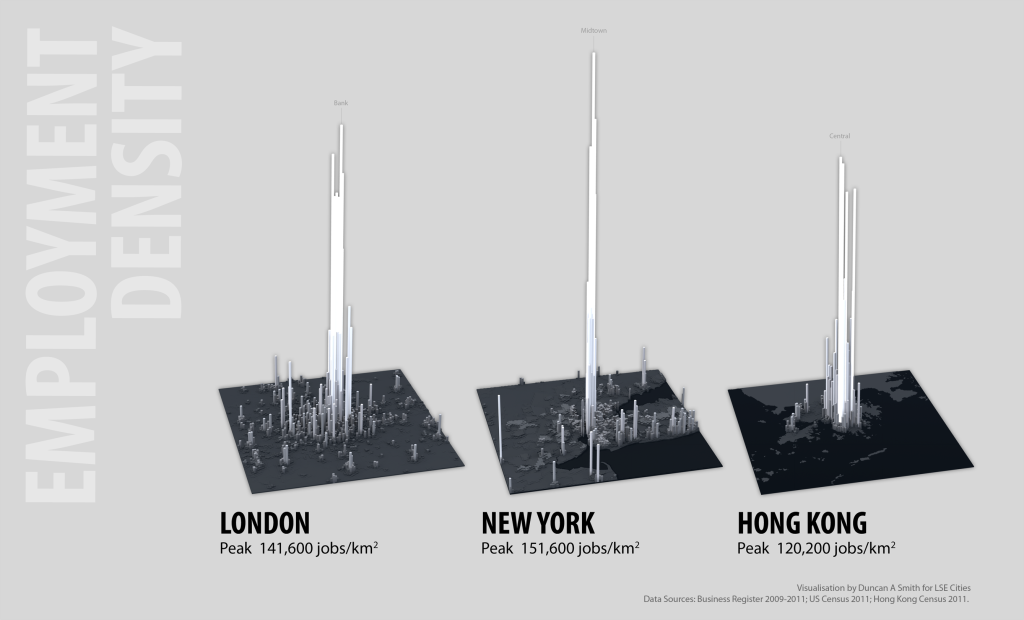
Where people live is not however the only perspective needed to understand urban density. We can also examine employment densities for an important point of comparison (both residential and employment maps are at the same scale). Taller spikes in the employment maps represent higher numbers of jobs concentrated in business centres. London, New York and Hong Kong feature very intensive central employment clusters. The highest peak of over 150,000 jobs per km2 is in Midtown Manhattan. London is surprisingly close behind at over 140,000 jobs per km2, concentrated in the City of London and the West End. Hong Kong peaks at 120,000 jobs per km2 in Central (note the Hong Kong survey data is less comprehensive and may underestimate peak densities). These intense spikes represent very strong agglomeration economies, where financial and business services and creative industries cluster together to access labour markets, share fast-changing information and engage in face-to-face interaction with clients, customers and partners. Despite living in an age of instant telecommunication, proximity is still critical for many world city business activities.
The extreme employment density peaks are indicative of economic success in these world cities. Demand for office space is so stong that developers get sufficient returns to build high and businesses use their space more intensively. Central employment clustering also means these cities are dominated by public transport rather than car travel (particularly Hong Kong). On the other hand the divergence of living and working densities can signify a lack of integration between living and working locations. London is very polarised between its low density living and high density working environments. This contributes to the long distance and long duration commuting travel for many Londoners (recent surveys find an average one-way commute times for Londoners of 38 minutes). New York has a better integration of living and working locations (average commutes are around 31 minutes). Hong Kong appears to have the closest integration of living and working spaces, though unfortunately commuting time survey data is not available to test this.
The analysis here supports the medium-rise inner-city residential intensification that the London Plan prescribes to improve the balance of urban functions, and increase accessibility for residents and businesses. The gap in residential densities between London and many world cities is so large that modest intensification can be achieved while keeping London’s distinct character, providing development is on the much remaining brownfield land rather than London’s treasured greenspaces.
Another interesting thought is whether the highly concentrated office clusters we see in London and New York will continue to be the way most businesses operate in the future. Greg Lindsay gave a good talk last week on how businesses are changing the way they use work space towards more shared and flexible environments that will likely be less space demanding.
To see more detailed analysis of sustainability trends in many more world cities from the Urban Age conference see the Electric City conference newspaper.


