Tube Tongues
I’ve extended my map of tube journeys and busy stations (previous article here) to add in an interesting metric from the 2011 census – that of the second most commonly spoken language (after English) that people who live nearby speak. To do this I’ve analysed all “output areas” which wholly or partly lie within 200m radius of the tube station centroid, and looked at the census aggregate data for the metric – which was a new one, added for the most recent census.
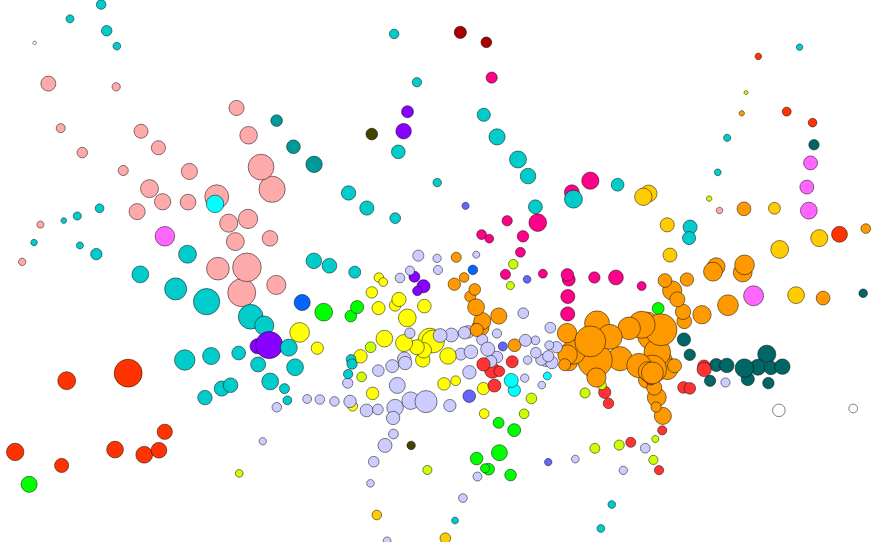
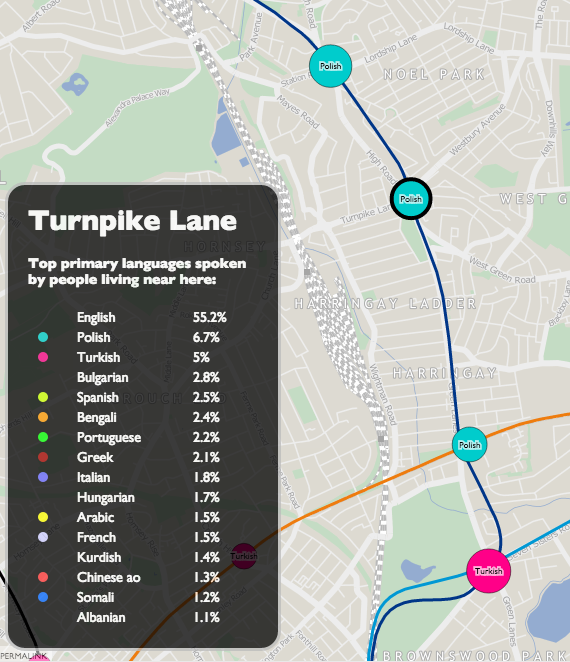
Each tube station has a circle coloured by, after English, the language most spoken by locals. The area of the circle is proportional to the percentage that speak this language – so a circle where 10% of local people primarily speak French will be larger (and a different colour) than a circle where 5% of people primarily speak Spanish.
Language correlates well with some ethnicities (e.g. South Asian) but not others (e.g. West Indies), in London. So some familiar patterns appear – a popular, and uniform, second language appearing at almost all Tower Hamlets stations.
Click on each station name to see the other languages spoken locally – where at least 1% of local speakers registered them in the census. There is a minimum of 10 people to minimise small numbers for some tube stations in very commercial/industrial districts. In some very mono-linguistic areas of London (typically in Zone 6 and beyond the GLA limits) this means there are no significant second languages, so I’ve included just the second one and no more.
This measure reveals the most linguistically diverse tube station to be Turnpike Lane on the Piccadilly Line in north-east London, which has 16 languages spoken by more than 1% of the population there. By contrast, almost 98% of people living near Theydon Bois, on the Central Line, speak English as their primary language. Perhaps the most curious category is at Barbican, where 1.1% of people, or around 40, speak a “Northern European language (non EU)”.
One quirk is that speakers of Chinese languages normally appear as Chinese ao (all other) rather than Cantonese, whereas actually in practice, the Chinese community do mainly speak Cantonese (Yue) in London. This is likely a quirk of the way the question was asked and/or the aggregate data compiled. Chinese ao appears as a small percentage right across London due to the traditional desire for Chinese restaurant owners to disperse well to serve the whole capital.
The idea/methodology is similar to that used by Dr Cheshire for Lives on the Line. The metric was first highlighted by an interesting map, Second Languages, created by Neal Hudson. The map Twitter Tongues also gave me the idea of colour coding dots by language.
I’ve also included DLR, Overground, Tramlink, Cable Car and the forthcoming Crossrail stations on the map. Crossrail may not be coming until 2018 but it’s very much making its mark on London, with various large station excavations around the capital.
The TfL lines (underground, DLR etc), station locations and names all come from OpenStreetMap data. I’ve put the collated, tidyed and simplified data, that appears on the map, as GeoJSON files on GitHub GIST.


