

Tube Line Closure Map
The Tube Line Closure Map accesses Transport for London’s REST API for line disruption information (both live and planned) and uses the information there to animate a geographical vector map of the network, showing closed sections as lines flashing dots, with solid lines for unaffected parts. The idea is similar to TfL’s official disruption map, however the official one just colours in the disrupted links while greying out the working lines (or vice versa) which I think is less intuitive. My solution preserves the familiar line colours for both working and closed sections.
My inspiration was the New York City MTA’s Weekender disruptions map, because this also blinks things to alert the viewer to problems – in this case it blinks stations which are specially closed. Conversely the MTA’s Weekender maps is actually a Beck-style (or actually Vignelli) schematic whereas the regular MTA map is pseudo-geographical. I’ve gone the other way, my idea being that using a geographical map rather than an abstract schematic allows people to see walking routes and other alternatives, if their regular line is closed.
Technical details: I extended my OpenStreetMap-based network map, breaking it up so that every link between stations is treated separately, this allows the links to be referenced using the official station codes. Sequences of codes are supplied by the TfL API to indicate closed sections, and by comparing these sequences with the link codes, I can create a map that dynamically changes its look with the supplied data. The distruption data is pulled in via JQuery AJAX, and OpenLayers 3 is used to restyle the lines appropriately.
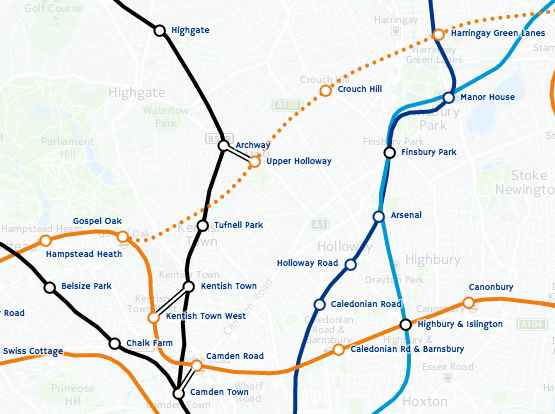
Unfortunately TfL’s feed doesn’t include station closure information – or rather, it does, but is not granular enough (i.e. it’s not on a line-by-line basis) or incorrect (Tufnell Park is shown only as “Part Closed” in the API, whereas it is properly closed for the next few months) – so I’m only showing line closures, not station closures. One other interesting benefit of the map is it allows me to see that there are quite a lot of mistakes in TfL’s own feed – generally the map shows sections open that they are reporting as closed. There’s also a few quirks, e.g. the Waterloo & City Line is always shown as disrupted on Sundays (it has no Sunday service anyway) whereas the Rominster Line in the far eastern part of the network, which also has no Sunday service, is always shown as available.
Try it out
- Tube Line Closure Map (all lines, this coming weekend)
- Tube Line Closure Map (just the London Overground, next weekend)
- Tube Line Closure Map (live right now)