Parametrizing and interpreting OPTICSxi Clustering
For a while now, I have been working on the application of the OPTICS clustering, for user generated data in cities.
OPTICS is a density-based algorithm that attempts to overcome some of the “weaknesses” of its most famous counterpart: DBSCAN. The major weaknesses of DBSCAN are:
- the inability to detect clusters in zones of varying density.
- the choice of parameter values, for which it is very sensitive.
I am using an implementation from the ELKI Data Mining libraries, which is one of the few existing ones. Unlike DBSCAN, the OPTICS algorithm does not produce a strict cluster partition, but an augmented ordering of the database. To produce the cluster partition, I use OPTICSxi, which is another algorithm that produces a classification based on the output of OPTICS. There are even fewer libraries capable of extracting a cluster partition from the output of OPTICS, and ELKI’s OPTICSxi implementation is one of the few ones.
In a nutshell, the parameters needed for the OPTICS algorithm are:
- epsilon: this parameter is meant as a “maximum” distance to consider, and not a specific distance to consider (DBSCAN); a whole range of distances is considered in the OPTICS algorithm, up to epsilon; although we can choose an “extremely” large epsilon, that will increase the time the algorithm will take to converge;
- minpts: this is the number of points required to form a cluster (the same as in DBSCAN);
The OPTICSxi algorithm adds an “extra” parameter:
- xi: contrast parameter, that establishes the relative decrease in density; this parameter controls directly the number of classes we will obtain.
Taking in consideration what I wrote above, if we “replace” DBSCAN by OPTICxi, we will still have to choose a min points, the epsilon will become less important (but we still need to set it), and suddenly we have a “new” parameter to set: xi. I am not completely sure this is a gain in terms of easier parametrization….
It is very clear to me, how-to interpret the results of DBSCAN (although it is not that easy, to set “meaningful” global parameters); DBSCAN detects a “prototype” of a cluster, characterized by a density, expressed as a number of points per area (minpts/epsilon). The results of OPTICSxi seem a bit more difficult to interpret.
The clusters generated by OPTICSxi are hierarchical, where “outer” clusters (lower in the hierarchical scale), contain inner clusters (or “child” clusters). Looking at the algorithm, it is clear that the idea of varying densities, is implemented by having a range of epsilon parameters, that is actually based on the data. When we set the “contrast” parameter, we actually “decide”, which density variation we accept, in order to consider that group a cluster. Because the algorithm is focused on “density variation”, rather than on a global value of density (or a “prototype”), it may well happen that areas that have a very low density appear as a cluster, just because they have a density variation from their surrounds that is greater than the accepted threshold. Likewise, we may have areas that are extremely dense, and are not detected as clusters, because there is a smooth density variation from their surroundings. In terms of interpretation this may well result in a bottleneck.
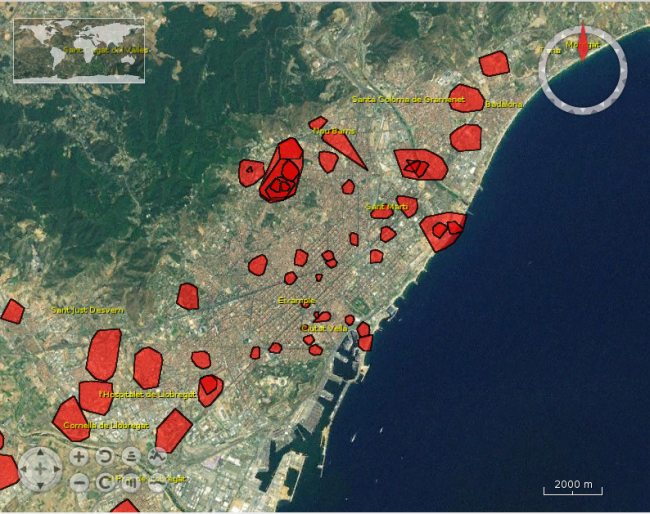
On the image bellow, we see clusters in parts of the city that are not particularly dense (like the West) and are not detected as clusters by DBSCAN. On the other hand, the centre of the city (more dense), as only a few clusters.
epsilon=500; xi=0.03; minpts=150;
It is interesting to note, that since OPTICS does not impose a strict “prototype” of density, the clusters in denser areas (in the centre of the city) are smaller in area than the clusters in less dense areas (the surroundings).
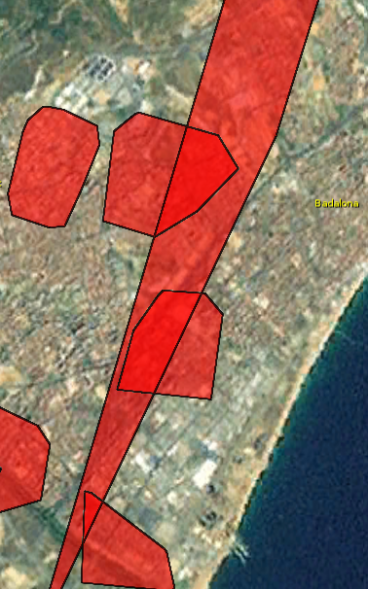
There are two phenomena that I sometimes detect in the outputs of OPTICSxi, and that I am not able to explain. One is the appearance of “spike” clusters, that link parts of the map. I cannot explain them, because they seem to be made of very few points and I don’t understand how the algorithm decides to group them in the same cluster. Do they really represent a “corridor” of density variation? looking at the underlying data, it does not look like that. You can see these “spikes” in the image bellow.

epsilon=1000; xi=0.05; minpts=100;
The other phenomenon that I cannot explain is the fact that sometimes there are overlapping clusters of the same hierarchical level. OPTICSxi is based on the OPTICS ordering of the database (e.g. dendrogram) and there are no repeated points in that diagram.
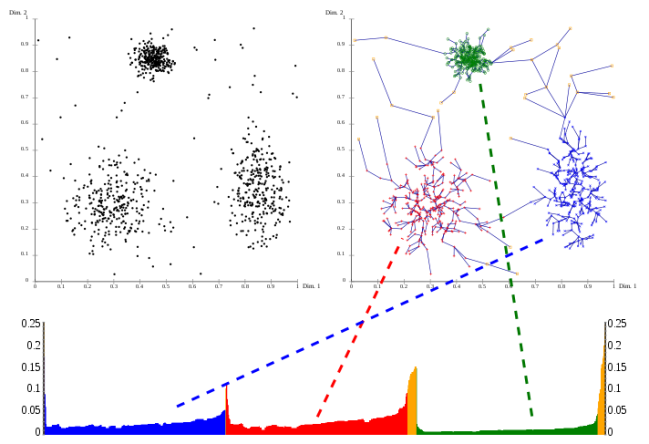
http://en.wikipedia.org/wiki/OPTICS_algorithm
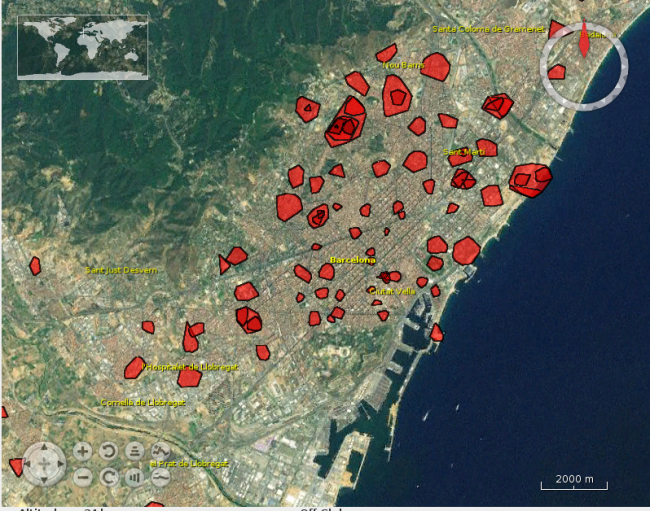
Since this is a hierarchical clustering, we consider that clusters of a lower level contain clusters of a higher level, and that idea is enforced when building the convex hulls. However, I don’t see any justification for having clusters that intersect other clusters on the same hierarchical level, which in practice would mean that some points would have a double cluster “membership”. On the image bellow, we can see some intersecting clusters with the same hierarchical level (0).
Finally the most important thought/question that I want to leave you with, is: what do we expect to see in an OPTICSxi cluster classification? This question is closely linked to the task of parametrizing OPTICSxi.
Since I see hardly any studies with runs of OPTICSxi for a particular cluster problem, I struggle to find what is an optimal clustering classification would be; i.e.: one that can provide some meaningful/useful results, and add some value to the DBSCAN clustering. To help me answering that question, I performed many runs of OPTICSxi, with different combinations of parameters, and I selected three that I will discuss bellow.

epsilon=2000; xi=0.025; minpts=100;
On this run I used a large value of epsilon (2Km); the meaning of that value is that we accept large clusters (up to 2Km); since the algorithm “merges” clusters, we will end up with some very large clusters, that will have almost certainly a low density. I like this output, because it exposes the hierarchical structure of the classification, and it actually reminds me of several runs DBSCAN with a different combination of parameters (for different densities), which is the advertised “strength” of OPTICS. As it was mentioned before, smaller clusters correspond to higher levels in the hierarchical scale, and higher densities.
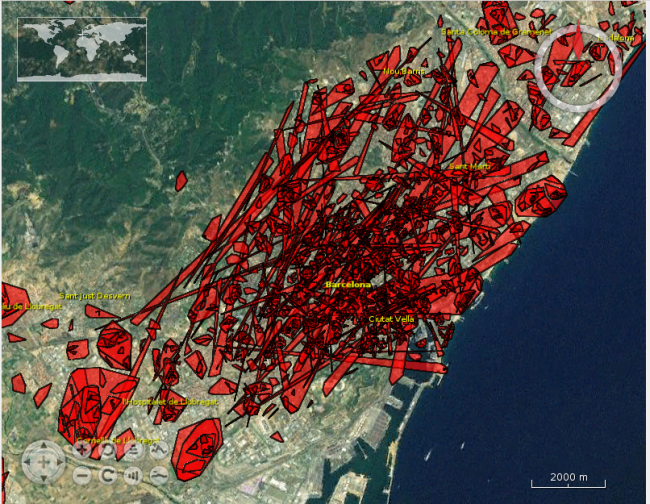
epsilon=250; xi=0.035; minpts=10;
On this run we see a large number of clusters, even if the “contrast” parameter is the same from the previous run. That is mostly because I chosen a low number of minpts, which established that we accept clusters with a low number of points. Since the epsilon in this case is shorter, we don’t see these large clusters occupying a large part of the map. I find this output less interesting than the previous one, mostly because, even if we have an hierarchical structure there are many clusters at the same level, and many of them intersect. In terms of interpretation, I can see an overall “shape” that is similar to the previous one, but it is actually discretized in lots of small clusters that are easily overlooked as “noise”.
epsilon=250; xi=0.035; minpts=100;
This run has a parameter choice that is similar to the previous one, except that the minpts is larger; the consequences is that not only we find less clusters and they overlap less, but also that they are mostly at the same level.
In a perspective of adding value to DBSCAN, I would opt for the first combination of parameters, since it provides a hierarchical picture of the data, exposing clearly which areas are more dense. IMHO the last combination of parameters, fails to provide an idea of the global distribution of density, since it is finding similar clusters all over the study area.

