Mapping the Densification of Cities in England & Wales using the 2011 Census
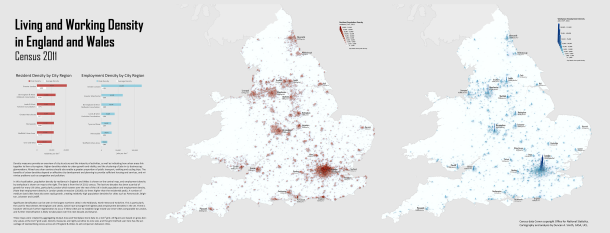
UK cities have been undergoing significant change over the last decade, and the 2011 census data provides a great basis for tracking current urban structure. I’ve mapped population and employment density for all of England and Wales in 2011, using a 1km2 grid scale approach-
The main themes that emerge are the dramatic intensification of London, high densities in some medium sized cities such as Leicester and Brighton, and the regeneration of the major northern conurbations, with Manchester and Birmingham as the largest employment hubs outside of London.
Mapping all of England and Wales together is a useful basis for considering city-regions and their connections (note Scotland has not yet published census 2011 employment data and is not mapped). Certainly this is a major theme in current policy debates grappling with the north-south divide and proposed high-speed rail links. I’ll be looking at densities in relation to network connections in future posts as this topic is part of ongoing research at CASA as part of the MECHANICITY project.
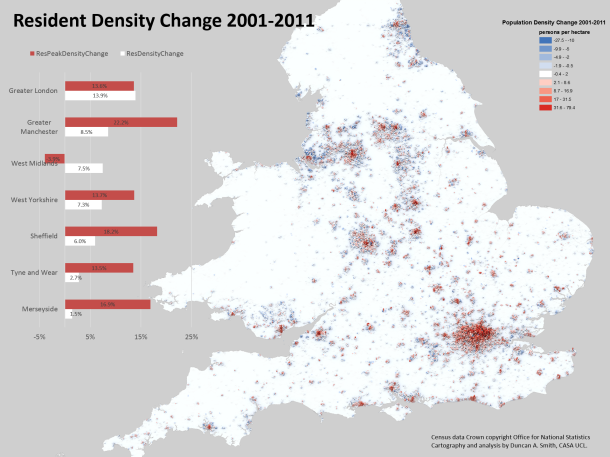
It is also possible to directly map changes in density between using the same visualisation approach (note the grid height describes density in 2011, while colour describes change in density between 2001-2011)-
The change map really highlights the pattern of city centre intensification combined with static or marginally declining suburbs in England and Wales. This trend was discussed in a previous post. The two statistics of peak and average densities reinforce the city centre versus suburbs divide, with peak density measurements growing much more than average densities. But the peak density statistic is somewhat unreliable (such as in the case of Birmingham/West Midlands) and we will be doing further work at CASA to define inner cities and produce more robust statistics of these trends.
Notes on the Analysis Method-
The density values were calculated from the smallest available units- Output Area population and Workplace Zone employment data from the 2011 census. This data was transformed to a 1km2 grid geography using a proportional spatial join approach, with the intention of standardising zone size to aid comparability of density measurements between cities. The transformation inevitably results in some MAUP errors. These are however minimised by the very fine scale resolution of the original data, which is much smaller than the grid geography in urban areas.
The workplace zone data is a very positive new addition by the Office for National Statistics for the 2011 census. There is a lot of new interesting information on workplace geography- have a look at my colleague Robin Edward’s blog, where he has been mapping this new data.
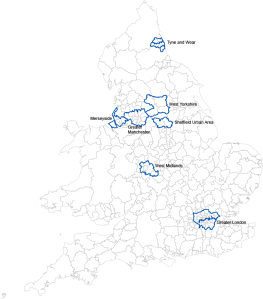
Defining city regions is another boundary issue for these statistics. I’ve used a simple approach of amalgamating local authorities, as shown below-


