Call for Papers: Agent-Based Models of Geographical Systems

Call for Papers: Agent-Based Models of Geographical Systems
IGU Leeds, Applied GIS and Spatial Modelling: 29 May – 2 June 2013

The use of agent-based models is now becoming widespread within the social sciences. With the maturity of these methodologies, there has been an accompanying development in applications for exploring a wide range of geographical, and more broadly, social sciences problems facing society.

The aim of this session is to bring together researchers who are using ABM within the context of Applied GIS or Spatial Modelling.  Papers which explore the relationships between ABM and other related techniques such as spatial microsimulation or cellular automata, and their uses within policy frameworks of substantive applications to geographical problems, will be particularly welcome.
Specific areas of interest include the following:

  • Linking ABM to GIScience and visualization of models and their outputs
  • Work concerned with the calibration, verification and validation of models, or the development of appropriate methods such as genetic algorithms and other geocomputational methods
  • The use of models alongside new forms of data such as social media or volunteered geographical information
  • Representations of agent behavior within geographical systems
  • Substantive applications to geographical problems and policy issues
  • Papers which explore the interactions and linkages to other methods and techniques

Important Dates:

  • Abstract submission: 250 – 300 words before Dec 01 2012
  • Notification: before Feb 01 2013
  • Conference dates: May 29th – 2nd June 2013, Leeds, UK.

Organizers:

Continue reading »

Call for Papers: Agent-Based Models of Geographical Systems

Call for Papers: Agent-Based Models of Geographical Systems
IGU Leeds, Applied GIS and Spatial Modelling: 29 May – 2 June 2013

The use of agent-based models is now becoming widespread within the social sciences. With the maturity of these methodologies, there has been an accompanying development in applications for exploring a wide range of geographical, and more broadly, social sciences problems facing society.

The aim of this session is to bring together researchers who are using ABM within the context of Applied GIS or Spatial Modelling.  Papers which explore the relationships between ABM and other related techniques such as spatial microsimulation or cellular automata, and their uses within policy frameworks of substantive applications to geographical problems, will be particularly welcome.
Specific areas of interest include the following:

  • Linking ABM to GIScience and visualization of models and their outputs
  • Work concerned with the calibration, verification and validation of models, or the development of appropriate methods such as genetic algorithms and other geocomputational methods
  • The use of models alongside new forms of data such as social media or volunteered geographical information
  • Representations of agent behavior within geographical systems
  • Substantive applications to geographical problems and policy issues
  • Papers which explore the interactions and linkages to other methods and techniques

Important Dates:

  • Abstract submission: 250 – 300 words before Dec 01 2012
  • Notification: before Feb 01 2013
  • Conference dates: May 29th – 2nd June 2013, Leeds, UK.

Organizers:

Continue reading »

New paper: Agent-based modeling for community resource management: Acequia-based agriculture

We have just got a paper accepted in Computers, Environment and Urban Systems entitled “Agent-based modeling for community resource management: Acequia-based agriculture.” In the paper we explore the complex social interactions of water management, which involves landowners collectively maintaining and managing ditches which distribute water among the properties.

This system of the physical ditches and the maintaining organization together is known as an acequia, and the landowners who maintain it are called Parciantes. Acequias are interesting to researchers because of the developed common property regimes they require to function. The water carried by the ditches is a shared resource, and the complex management system of the acequia has evolved to avoid Hardin’s tragedy of the commons with regard to natural resources in the sense that it prevents the resource from being overused or under-maintained to the detriment of everyone. Ostrom has extensively studied the process of sharing such resources, investigating the structures set in place to preserve them. In ‘‘Governing the Commons’’, her book on common pool resources and human–ecosystem interactions, she suggests a set of characteristics that define stable communal social mechanisms. These characteristics include the presence of environment-appropriate rules governing the use of collective goods and the efficacy of individuals in the system.

Below is the abstract from the paper:

Water management is a major concern across the world. From northern China to the Middle East to Africa to the United States, growing populations can stress local water resources as they demand more water for both direct consumption and agriculture. Irrigation based agriculture draws especially heavily on these resources and usually cannot survive without them; however, irrigation systems must be maintained, a task individual agriculturalists cannot bear alone. We have constructed an agent-based model to investigate the significant interaction and cumulative impact of the physical water system, local social and institutional structures which regulate water use, and the real estate market on the sustainability of traditional farming as a lifestyle in the northern New Mexico area. The regional term for the coupled social organization and physical system of irrigation is ‘‘acequias’’. The results of the model show that depending on the future patterns of weather and government regulations, acequia-based farming may continue at near current rates, shrink significantly but continue to exist, or disappear altogether.
In the figure below we show some of our efforts in verification of the model, specifically, the water network, after 100 years of regular maintenance (A) and after 100 years of no maintenance (B). The darker the line, the more clear the segment is of sedimentation; only unmaintained acequias are impacted by sedimentation in this model, and appear in lighter shades.

Below is a movie are a few sample model runs showing how different scenarios play out, specifically with respect to land-use change.

Full reference:

Wise, S. and Crooks, A. T. (2012), Agent Based Modelling and GIS for Community Resource Management: Acequia-based Agriculture, Computers, Environment and Urban Systems. Doi http://dx.doi.org/10.1016/j.compenvurbsys.2012.08.004.
Continue reading »

Traffic Movement in London from Travel Cards

Why and how do people move around cities? Is it to get to work or to meet people? These are some questions one can explore if one has data. One can also explore what happens if a key transit stations or links is closed and how will this impact on the rest of the city.
Researchers from UCL have analyzed millions of Oyster Card journeys in a bid to understand how, why and where we travel in London. They used Transport for London’s database of 11 million records taken over one week from the Oyster Card electronic ticketing system.
Professor Michael Batty (UCL Centre for Advanced Spatial Analysis) and Dr Soong Kang (UCL Management Science and Innovation) applied the techniques of statistical physics to their mountain of raw data.


Such data could also be very useful if one was trying to build some spatial interaction models or hybrid agent-based models of residential location and employment or pedestrian models.
Thanks to Digital Urban and Mike Batty for pointing this work out to me.
Continue reading »

Call for papers: Intelligent Agents in Urban Simulations and Smart Cities

Readers of the blog might be interested in the “Intelligent Agents in Urban Simulations and Smart Cities” workshop at the  ECAI-2012 Conference in Montpellier, France, August 27 or 28, 2012.

To quote from the call for papers:

In this workshop, we intend to address specific methodological and technological issues raised by the deployment of agents in rich environments such as virtual cities. We will welcome contributions tackling issues related to reactive agents, cognitive architectures, the capacity to scale up to handle thousands or hundreds of thousands of agents, the ability to simulate realistic group behaviors which might be judged non rational, etc., all in the context of urban agents. We will also welcome contributions showcasing original applications of agent and multi-agent technologies within urban simulations, be it for design, planning, education, training, or entertainment. 

Workshop Chairs: 

  • Vincent Corruble (contact), Université Pierre et Marie Curie (Paris 6), France 
  • Fabio Carrera, Worcester Polytechnic Institute (WPI), USA 
  • Stephen Guerin, Santa Fe Complex, USA 

Important Dates: 

  • *6 June 2012*: Workshop paper submission deadline 
  • 28 June 2012: Notifications to authors (subject to modification) 
  • 13 July 2012: Submissions of camera-ready copies of selected papers 
  • 27 or 28 August 2012: Workshop date 

Submission information: 

Continue reading »

A Semester with OpenSim

Over the last few months I have been teaching a class in the Department of Computational Social Science entitled “Building Virtual Worlds” where we surveyed the role of virtual worlds for social science research. The emphasis of the class was on tools, software frameworks, and applications of virtual worlds.  On the applications side we discussed how virtual worlds are being used for History, Archeology, Healthcare, Tourism, Urban Modeling, Architecture, Agent-based Modeling along with more generally teaching and learning. We explored a variety of tools for building virtual worlds before focusing on OpenSim. The movie below shows some of the final outputs using OpenSim.
We used OpenSim 0.7.3, configured with the Standalone-Hypergrid mode and a SQLite database hosted on a Windows 7 server. The server simultaneously simulated 64 different regions, and at various points during the semester the server hosted well over 15000 primitives (prims) and ran hundreds of scripts across this landscape; one region alone hosted over 8000 prims. 
Why so many regions? We were interested in how many the server could cope with but also we wanted to have a virtual world representing the whole of the GMU Fairfax campus  (~4km2) and regions in OpenSim are limited to 256m by 256m. We built the terrain for the campus utilizing the National Elevation Dataset (NED) DEM from the United States Geological Survey which was first manipulated in ArcGIS before being processed in  L3DT (Large 3D Terrain Generator). Finally, the DEM was imported into OpenSim. The movie below should give a sense of what the basic terrain looks like.
Once the terrain was built, we populated it with buildings, however, we were not just interested in the external appearance of the buildings but also there internal structure for modeling and simulation purposes.  Therefore the class focused their attention on building a highly detailed Johnson Center.
Model of Johnson Center taken from Google SketchUp 3D Warehouse
Vector based, 2D CAD files were obtained and imported into Google SketchUp before using SketchLife to build the 3D initial building core, walls, doors and windows.

Constructing a vector-based model of the Johnson Center internal structure
The SketchLife final rendering of the Johnson Center
Once built in SketchUp using SketchLife the model was imported into OpenSim 

External view “in world” of what we accomplished in building the Johnson Center
In addition to using SketchLife for the JC, many objects such as chairs, staircases and tables were either built using the tool or those native to OpenSim.
An “in world” shot at ground level, on the 1st floor, viewing the atrium and clock tower
 in the Johnson Center
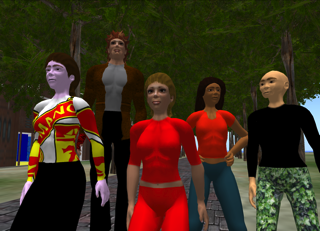
CSS class photo “in-world”
However, our work with OpenSim does not stop here, below is another movie of some ongoing work with one of our PhD students, Chris Rouly who is creating agent-based models embedded in OpenSim to explore past habitats among many other things.
I would like to thank the “Building Virtual Worlds” class and the Department for enabling this blog post.

Continue reading »

Natural Disasters and Crowdsourcing: Haiti

Natural disasters such as earthquakes and tsunamis occur all over the world, altering the physical landscape and often severely disrupting people’s daily lives. Recently researchers’ attention has focused on using crowds of volunteers to help map the infrastructure and devastation caused by natural disasters, such as those in Haiti and Pakistan. For example, in the movie below shows the response to the earthquake by the OpenStreetMap community within 12 hours of the earthquake. The white flashes indicate edits to the map (often by tracing satellite/aerial photography).
While this data is extremely useful, as it is allows us to assess damage and thus aid the distribution of relief, but it tells us little about how the people in such areas will react to the devastation, the supply of food, or the reconstruction. To address this, we are exploring how agent-based modeling can be used to explore peoples reactions. To do this we have created a prototype spatially explicit agent-based model, created using crowdsourced geographic information and other sources of publicly available data, which can be used to study the aftermath of a catastrophic event. The specific case modeled here is the Haiti earthquake of January 2010. Crowdsourced data is used to build the initial populations of people affected by the event, to construct their environment, and to set their needs based on the damage to buildings. 

The idea behind the model is to explore how people react to the distribution of aid, as well as how rumors propagating through the population and crowding around aid distribution points might lead to food riots and similar social phenomena. Such a model could potentially provide a link between socio-cultural information of the people affected and relevant humanitarian relief organizations.

<p><p>sssss</p></p>

The animation above shows one simulation run where there is the spread of  information and agent movement (red dots) around one center (blue dot). While the chart below shows how over time the density of agents around the food station increases over time.

The idea behind such a model is one can take crowdsourced information and fuse it into an agent-based model and see how people will react to the distribution of food centers. For example, the movie below shows how agents find out about four (hypothetical) different food centers and decide whether or not to go to them in a 6 by 8km area of Port-au-Prince.

Spread of information and agent movement (red dots) in a 6 by 8km area of Port-au-Prince.
More details about this model to come……
Continue reading »

#Earthquake: Twitter as a Distributed Sensor System

Our work on using social media continues to develop and we have recently had a paper accepted in Transactions in GIS, entitled “#Earthquake: Twitter as a Distributed Sensor System“. Below we present our abstract and some of the results.

Social media feeds are rapidly emerging as a novel avenue for the contribution and dissemination of information that is often geographic. Their content often includes references to events occurring at, or affecting specific locations. Within this paper we analyze the spatial and temporal characteristics of the twitter feed activity responding to a 5.8 magnitude earthquake which occurred on the East Coast of the United States (US) on August 23, 2011. We argue that these feeds represent a hybrid form of a sensor system that allows for the identification and localization of the impact area of the event. By contrasting this to comparable content collected through the dedicated crowdsourcing ‘Did You Feel It?’ (DYFI) website of the US Geological Survey we assess the potential of the use of harvested social media content for event monitoring. The experiments support the notion that people act as sensors to give us comparable results in a timely manner, and can complement other sources of data to enhance our situational awareness and improve our understanding and response to such events.

The movie below show geolocated tweets with references to the earthquake through keyword (earthquake or earth and quake) and hashtag search (#earthquake or #quake) for the first hour after the earthquake.

The following images give a glimpse at some of our analysis.

Response pattern as function of distance from epicenter for the first 400 seconds after the earthquake. At the top we see a plot of (reaction time, distance) of all tweets during that period. At the bottom we show the histogram of the number of tweets as a function of distance.
Locations of the 40 tweets in the shaded area of the figure above overlaid over the USGS CDI scale map. Tweet locations are marked as green circles. Color-coding in the graph is ranging from red (high perceived intensity) to yellow (lower perceived intensity). The dashed line shows a distance of approximately 950 km (8.5 degrees of angular distance) from the epicenter.

The movie below gives you an idea of some of the tweet content:

Full reference to this paper is:

Crooks, A. T.,  Croitoru, A.,  Stefanidis, A. and Radzikowski, J. (acepted) “#Earthquake: Twitter as a Distributed Sensor System” Transactions in GIS.

Continue reading »

Distributed MASON

Last week, the Center for Social Complexity at GMU, hosted Prof. Vittorio Scarano and Carmine Spagnuolo from the ISISLab of the Università degli Studi di Salerno who have been working on a distributed version of MASON (DMason). The idea is that one can create an agent-based model in MASON and then use the framework to easily distribute it over many machines. The movie below shows an example of what can be done. More information can be found here.

However, if you don’t use MASON, you might also be interested in Repast for High Performance Computing

Continue reading »

ElectionGauge

A project we have been working on at GMU called ElectionGauge has now gone live (although still under development). The idea about the project is tie geo-spatial analysis, linguistic analysis, and social network analysis to analyze Twitter responses to the upcoming US elections in real time with the aim of predicting election results.
One question we are exploring is  do the tweets of users match the speech of candidates? For example, as Maksim Tsvetovat, one of the co-founders says “repeal Obamacare” might identify you as Tea Partier, while “legalize marijuana” puts you in Ron Paul’s camp. While still in beta, below is snapshot from the site:

Find out more see: @maksim2042, @JackieKazil & @ElectionGauge or at Tech Cocktail

Continue reading »
1 8 9 10 11 12 13