Many maps use overlays to display different types of features on the map. Many examples show old hand drawn maps that have been re-projected to fit on our modern day, online ‘slippy’ map but
very few show these overlays over time. In this tutorial we are going to explore animations using the Google Maps iOS SDK to show the current live weather conditions in the UK.
The Met Office is responsible for reporting the current weather conditions, issuing warnings, and creating forecasts across the UK. They also provide data through their API, called DataPoint, so that
developers can take advantage of the live weather feeds in their apps. I’ve used the ground overlays from DataPoint to create a small iOS application, called Synoptic, to loop around the real-time overlays
and display them on top of a Google Map, very handy if your worried about when it’s going to rain.
Finished App and Source Code
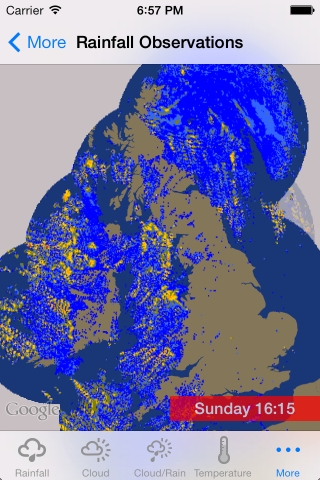
I always find it interesting when these tutorials show you what we’re going to create before digging deep into the code so here is a small animation on the right of the page of what the end product should look like.
What you’re looking at is the real-time precipitation, or rain, observations for the UK on Sunday 19th January 2014. It’s been quite sunny in London today so much of the rain is back home in
the North. You can grab a copy of the code for this tutorial from GitHub.
Before we get started
They’re a few things we need before we can start putting the data onto the map. Firstly, you’ll need an API key for Google Maps iOS SDK and you can access this by turning on the SDK from the
Cloud Console (https://cloud.google.com/console/). If you haven’t created a project yet then click Create Project and give your project a name and a unique id. I have a project called
TestSDK, which I use when I’m playing around with various API’s from Google. Follow the instructions on https://developers.google.com/maps/documentation/ios/start#the_google_maps_api_key
for getting your key. If you’ve downloaded the code from GitHub then the bundle identifier is set up as com.stevenjamesgray.Synoptic.
You’ll also need to sign up for a key for DataPoint. Once you’ve
registered for the API they’ll email you a key and your good to go.
Step 1 – Setting up the keys and running the project
When you have your keys and source code then open the project in Xcode and copy and paste your keys into Constants.m (it’s in the Object folder). If the keys are valid then you’ll be able to
build and run the project and you’ll start to download the overlay images and they’ll start to animate. I’ve already setup the mapView in the project but if you haven’t used the Google Maps
iOS SDK before then you should check out Mano Marks excellent HelloMap example on Google Developers Live. This will get you up to speed with creating a MapView and linking it into your project. The only extra part I’ve added is a custom base layer which will be covered in
another blog post.
Downloading the weather data
Datapoint has 2 types of data that can be visualised – observations and forecasts which, naturally, are contained in 2 separate API endpoints. If you look at Constants.m you’ll see the URL
to both endpoints:
NSString* const api_forecast_layers_cap = @"http://datapoint.metoffice.gov.uk/public/data/layer/wxfcs/all/json/capabilities?key=%@";
NSString* const api_obs_layers_cap = @"http://datapoint.metoffice.gov.uk/public/data/layer/wxobs/all/json/capabilities?key=%@";
If you copy the URL and paste it into your browser along with your key you’ll find that this JSON file lists all the layers that are available from the Met Office and where you can fetch the
images from the server. For observations we fetch the LayerName, ImageFormat (for us on iOS it will be png), the Time of the image (the timestamp of the image given by the time array – watch
out for the Z on the end) and most importantly our API key. Once we have constructed this URL we fetch the image.
-(void) selectLayer: (NSString*)layerID withTimeSteps: (NSArray *)timestep_set{
    for(NSString *timestep in timestep_set){

        NSURL *hourlyCall = [NSURL URLWithString: [NSString stringWithFormat: @"http://datapoint.metoffice.gov.uk/public/data/layer/wxobs/%@/png?TIME=%@Z&key=%@", layerID, timestep, MET_OFFICE_API_KEY]];

        NSLog(@"Calling URL: %@", [hourlyCall absoluteString]);
        NSURLRequest *request = [NSURLRequest requestWithURL: hourlyCall];
        AFImageRequestOperation *operation = [[AFImageRequestOperation alloc] initWithRequest:request];
        [operation setCompletionBlockWithSuccess:^(AFHTTPRequestOperation *operation, id responseObject) {

            //Check for a UIImage before adding it to the array
            if([responseObject class] == [UIImage class]){

                // Setup our image object and write it to our array
                SGMetOfficeForecastImage *serverImage = [[SGMetOfficeForecastImage alloc] init];
                serverImage.image = [UIImage imageWithData: operation.responseData];
                serverImage.timestamp = timestep;
                serverImage.timeStep = nil;
                serverImage.layerName = layerID;

                [overlayArray addObject: serverImage];

                // Increment our expected count so that we know when to start playing the animation
                imagesExpected = @([imagesExpected intValue] + 1);
                }
        } failure:^(AFHTTPRequestOperation *operation, NSError *error) {
                //We didn't get the image but that won't stop us!
                imagesExpected = @([imagesExpected intValue] + 1);
                NSLog(@"Couldn't download image.");
        }];

        [operation start];

    // Start the Timer to check that we have all the images we requested downloaded and stored in the layer array
        checkDownloads = [NSTimer scheduledTimerWithTimeInterval: 1 target:self selector:@selector(checkAllImagesHaveDownloaded:) userInfo: [NSNumber numberWithInt: [timestep_set count]] repeats: YES];
    }
}
This code fetches the images asynchronously and adds them into an array for us to use later in the code. We start a timer to check that we have downloaded all of our images before
starting to loop around the images on the map. The observant reader will notice that if we use loop around this array of images then they would be out of sync as we don’t know what order the images are downloaded so we need to sort them before we
show them on the map. This happens inside our checkAllImagesHaveDownloaded function. This is called every second and checks that all the images are downloaded. If we’ve got all the images then we clear the timer,
sort the array and then kick off the animation on the map. We sort the array using a Comparator which will compare the timestamps of each of the objects and orders them in asending order.
if([imagesExpected isEqualToNumber: imageFiles]){
        [checkDownloads invalidate];

        NSArray *sortedArray;
        sortedArray = [overlayArray sortedArrayUsingComparator:^NSComparisonResult(SGMetOfficeForecastImage *a, SGMetOfficeForecastImage *b) {
             return [a.timestamp compare: b.timestamp];
        }];

        overlayArray = [NSMutableArray arrayWithArray: sortedArray];
    ...
Animating the Layers on the Map
When we are ready to animate we create yet another timer which will call the updateLayer method every second. This is where the magic happens! The images we have downloaded from
the Met Office have been created to fit the following bounding box: 48° to 61° North and 12° West to 5° East. This is really easy to convert into decimal degrees using the following rule. Anything west of the
meridian is a negative number and anything east is, of course, positive. Now that we know the bounding box then we create references to the bottom left and top right corners of the
image using the following code:
CLLocationCoordinate2D UKSouthWest = CLLocationCoordinate2DMake(48.00, -12.00);
CLLocationCoordinate2D UKNorthEast = CLLocationCoordinate2DMake(61.00, 5.00);
We grab our current image from the array by using a counter that has been set in the loadView method and then put it on to the map. We set the bearing of the image to 0 (we don’t need
to rotate the image as it’s already in North/South orientation), set the z-index of the image and then add it to the map by setting the ground overlays map property to the mapView we created and set
in the loadView method (our only map object)
GMSCoordinateBounds *uk_overlayBounds = [[GMSCoordinateBounds alloc] initWithCoordinate:UKSouthWest
                                                                             coordinate:UKNorthEast];

GMSGroundOverlay *layerOverlay = [GMSGroundOverlay groundOverlayWithBounds: uk_overlayBounds icon: layerObject.image];
layerOverlay.bearing = 0;
layerOverlay.zIndex = 5  * ([currentLayerIndex intValue] + 1);
layerOverlay.map = mapView;
Increment the counter and check that we haven’t got to the end of the array, if we have then we reset the counter and then wait a second until updateLayer is called again.
// Check if we're at the end of the layerArray and then loop
if([currentLayerIndex intValue] < [overlayArray count] - 1){
    currentLayerIndex = @([currentLayerIndex intValue] + 1);
}else{
    currentLayerIndex = @0;
}
If we run the code like this after we’ve looped around all the images we would get something that looks like this.

Unfortunately that’s not quite what we’re looking for! What’s happened is that we have created a new GroundOverlay object and put it on the map above the previous layer without removing the older layer
first. To fix this we need to keep an array of GroundOverlays so that we can remove the layer on the next loop and then remove the old layer from the array. This is done by loop around
the array and setting the map property of the older layer to nil like this:
//Clear the Layers in the MapView
for(GMSGroundOverlay *gO in overlayObjectArray){
    gO.map = nil;
    [overlayObjectArray removeObject: gO];
}
The app is now adding and removing the layers correctly and giving us the illusion of animation on the map.
The complete method to add the current image and remove the old image looks like this:
-(void) updateLayer: (id)selector{
    //Setup the bounds of our layer to place on the map
    CLLocationCoordinate2D UKSouthWest = CLLocationCoordinate2DMake(48.00, -12.00);
    CLLocationCoordinate2D UKNorthEast = CLLocationCoordinate2DMake(61.00, 5.00);

    //Get next layer and place it on the map
    SGMetOfficeForecastImage *layerObject = [overlayArray objectAtIndex: [currentLayerIndex intValue]];

    //Clear the Layers in the MapView
    for(GMSGroundOverlay *gO in overlayObjectArray){
        gO.map = nil;
        [overlayObjectArray removeObject: gO];
    }

    GMSCoordinateBounds *uk_overlayBounds = [[GMSCoordinateBounds alloc] initWithCoordinate:UKSouthWest
                                                                                 coordinate:UKNorthEast];

    GMSGroundOverlay *layerOverlay = [GMSGroundOverlay groundOverlayWithBounds: uk_overlayBounds icon: layerObject.image];
    layerOverlay.bearing = 0;
    layerOverlay.zIndex = 5  * ([currentLayerIndex intValue] + 1);
    layerOverlay.map = mapView;

    [overlayObjectArray addObject: layerOverlay];

    // Check if we're at the end of the layerArray and then loop
    if([currentLayerIndex intValue] < [overlayArray count] - 1){
           currentLayerIndex = @([currentLayerIndex intValue] + 1);
    }else{
           currentLayerIndex = @0;
    }
}
And there you go, animating ground overlays on Google Maps. I hope you’ve found this tutorial useful and if you have then why not share it with your developer friends or
follow me on Twitter (I’m @frogo) or Google+ (+StevenGray).
If you have any questions about this tutorial then either drop me a line via the social links above and I’ll try my very best to answer them. You can also follow the conversation over on Hacker News
Continue reading »


