Data Maps with Force Layout

forcelondon_2

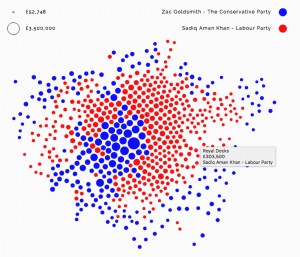
Alexander Brett has created this interactive map of London using the D3 visualisation framework and its “Force Layout” view. This places the data points (London ward centroids) at their geographic origin, and then applies a series of competing forces, as if the points are connected by a mesh of springs, to subtly adjust the locations […]

Continue reading »

Dear Data – My London

This is one of the many data visualisation and design postcards that Stefanie Posavec and Georgia Lupi sent each other of the course of a year. It’s a personal map of Stefanie’s London history – where she lived, studied and worked, her main commute and other routes. Everyone living in London will build up a […]

Continue reading »

‘Compactness’ in Zoning: the circle as the ideal.

I saw a thought provoking presentation recently, given by Wenwen Li of the University of California Santa Barbara, the talk was a wide ranging insight into Cyber Infrastructure, its uses for geospatial information, and some of the computational techniques that underpinned the project. One element of the project involved zone design for the greater Los […]

Continue reading »