Point Pattern Analysis using Ecological Methods in R

Here is a quick example for how to get started with some of the more sophisticated point pattern analysis tools that have been developed for ecologists – principally the adehabitathr package – but that are very useful for human data. Ecologists deploy point pattern analysis to establish the “home range” of a particular animal based […]

Continue reading »

Review: London, The Information Capital

londonpacman

Mapping London’s co-founder and “Editor at Large” Dr James Cheshire co-produced “London: The Information Capital” with Oliver Uberti in 2014. We mentioned the book on its initial release. The book has this month has now been published in a softback edition by Penguin, with some minor corrections applied. If you missed out on the book […]

Continue reading »

Data Maps with Force Layout

forcelondon_2

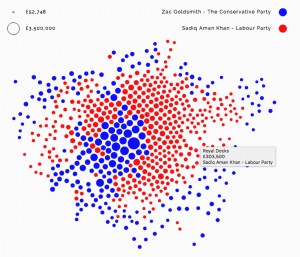
Alexander Brett has created this interactive map of London using the D3 visualisation framework and its “Force Layout” view. This places the data points (London ward centroids) at their geographic origin, and then applies a series of competing forces, as if the points are connected by a mesh of springs, to subtly adjust the locations […]

Continue reading »