New Paper: Generating and Analyzing Spatial Social Networks

We recently had a paper entitled “Generating and Analyzing Spatial Social Networks” accepted in Computational and Mathematical Organization Theory. In the paper we proposed and explored spatial versions of three well known networks, that of the Erdös-Rényi, Watts-Strogatz, and Barabási-Albert. Further details about the paper can be seen in the abstract below:

“In this paper, we propose a class of models for generating spatial versions of three classic networks: Erdös-Rényi (ER), Watts-Strogatz (WS), and Barabási-Albert (BA). We assume that nodes have geographical coordinates, are uniformly distributed over an m × m Cartesian space, and long-distance connections are penalized. Our computational results show higher clustering coefficient, assortativity, and transitivity in all three spatial networks, and imperfect power law degree distribution in the BA network. Furthermore, we analyze a special case with geographically clustered coordinates, resembling real human communities, in which points are clustered over k centers. Comparison between the uniformly and geographically clustered versions of the proposed spatial networks show an increase in values of the clustering coefficient, assortativity, and transitivity, and a lognormal degree distribution for spatially clustered ER, taller degree distribution and higher average path length for spatially clustered WS, and higher clustering coefficient and transitivity for the spatially clustered BA networks.”

Keywords: Spatial social networks, Network properties, Random network, Small-world network, Scale-free network.

The Python code for the models can be found here.

Full Reference: 

Alizadeh, M., Cioffi-Revilla, C. and Crooks, A. (2016), Generating and Analyzing Spatial Social Networks. Computational and Mathematical Organization Theory, DOI: 10.1007/s10588-016-9232-2 (pdf)


Continue reading »

Luminous Cities: offering an alternative way of geotag


Image1. The webpage of Luminous Cities_Manhattan

Studying human behaviours and communication in time and space has been regarded as the important factor of modern urban planning. In this digital era, collecting online data and analysing the data provide an opportunity to understand the intention and the process of the behaviours and the communication which had not been revealed.
Geotag, which is attached on Social Network Service (SNS), is concerned as one of connecting link between the internet and urban. Mainly, there are two types of geotag. One is user-generated geotag that SNS users identify the places on their contents. The other is automatically generated with spatial coordination by the services. It represents the political, social and economic characteristics of the places as well as the physical location of the user or the data produced.

There are many good examples of mapping the geotag data of SNS. Eric Fischer’s well known mapping images reveal not only the density of the geotag data but also social aspects in cities such as the invisible dimensions of tourism in New York (Image 2). Twitter Languages in London by James Cheshire and Ed Manley shows the popularity of languages depends on different locations in London ((Image 3).

Image2. The mapping geotag data of locals and tourists by Eric Fischer 

Image3. Twitter Languages in London, James Cheshire and Ed Manley


Luminous Cities is the project to demonstrate the interactive map of Flickr geotag data supported by CASA at UCL and CSAP at the University of Leeds. It has developed by Gavin Baily and Sarah Bagshaw. The project does not remain the displaying density and distribution of the geotag, but offers in-detail contents of the geotag such as user, tag, time of the day and timeline over 50 cities in the world. With the multiple contents, Luminous Cities could be a platform to check out the geotag data of Flickr based on personal interest, and to view their cities from a different side. When it comes to Networking City, who is interested in protest and demonstration in the city, it would be a helpful tool to examine the relationship between protests or occupy tags of Flickr in London and actual events of them. Also, some interesting results may be emerging when we compare two data sets: Flickr and Twitter.

Image4. Berlin user geotag map from the webpage of Luminous Cities

Image5. London occupy geotag map from the webpage of Luminous Cities

Image6. Tokyo geotag map, Zoom out, from the webpage of Luminous Cities

Image7. Tokyo geotag map, Zoom in, from the webpage of Luminous Cities

You can find more things from following links.
Flickr was shown as the highest growing application in 2013 by Mashable

Mapping the world with Flickr and Twitter by Guardian

Infographic Of The Day: Using Twitter And Flickr Geotags To Map The World

http://www.fastcodesign.com/1664462/infographic-of-the-day-using-twitter-and-flickr-geotags-to-map-the-world

Continue reading »

Geosocial Gauge Paper

As regular readers of the blog know, we have been spending a lot of time recently looking at social media and the growth in locational information within such media. To this end we are very happy to see one of our papers appear in the International Journal of Geographical Information Science. The paper is entitled “GeoSocial Gauge: A System Prototype for Knowledge Discovery from Social Media” which in essence discusses the challenge of merging diverse social media datasets into a single database which can then be used to generate geosocial knowledge. Below is the abstract:

“The remarkable success of online social media sites marks a shift in the way people connect and share information. Much of this information now contains some form of geographical content because of the proliferation of location-aware devices, thus fostering the emergence of geosocial media – a new type of user-generated geospatial information. Through geosocial media we are able, for the first time, to observe human activities in scales and resolutions that were so far unavailable. Furthermore, the wide spectrum of social media data and service types provides a multitude of perspectives on real-world activities and happenings, thus opening new frontiers in geosocial knowledge discovery. However, gleaning knowledge from geosocial media is a challenging task, as they tend to be unstructured and thematically diverse. To address these challenges, this article presents a system prototype for harvesting, processing, modeling, and integrating heterogeneous social media feeds towards the generation of geosocial knowledge. Our article addresses primarily two key components of this system prototype: a novel data model for heterogeneous social media feeds and a corresponding general system architecture. We present these key components and demonstrate their implementation in our system prototype, GeoSocial Gauge.”

Full reference:

Croitoru, A., Crooks, A.T., Radzikowski, J. and Stefanidis, A. (in press), GeoSocial Gauge: A System Prototype for Knowledge Discovery from Social Media, International Journal of Geographical Information Science. DOI: 10.1080/13658816.2013.825724

If you don’t have access to IGIS, send us an email and we can send you an early version of the paper.

Continue reading »

Review: City Sense – Shaping our environment with real-time data


Image1. The cover image of ‘City Sense – Shaping our environment with real-time data’

Since 2005, the Institute for Advanced Architecture of Catalonia in Barcelona, which is a provocative architectural school and research institution, has opened architectural competition once in every two years. This competition seeks new types of architectural experiments in the fast changing urban environment and is gaining an international reputation over the world. The most recent competition was held in 2011, and 275 groups participated in from 98 countries. The themes of the competition have expected ideal projections in the future rather than current urban situations; therefore, it is a bit harder to articulate architectural ideas of the themes than other competitions.
 
The book “City Sense – Shaping our environment with real-time data”, which was published by ACTAR, is the outcome of the competition in 2011 and the title of the book is the same as it of the competition. 
 
High speed information and communication technologies have created more possibilities of diversity, mobility and change in the city that comparatively the speed of change is lower than the speed of the technologies by its physical nature. Therefore, urban design and urban planning in the future would claim not traditional approaches for physical urban structure but more and more concerns of immaterial and invisible urban factors based on the development of the technology. In the preface of City Sense, Manuel Gausa, Dean of IAAC, argues that new urban dynamics will emerge from interactive, synchronous and integrated information in multi-level of urban areas, not physical characteristics any more. He explains the purpose of this competition was to find innovative ways of urban design for increasing civic participation, interactive response with the urban environment and real-time information. 
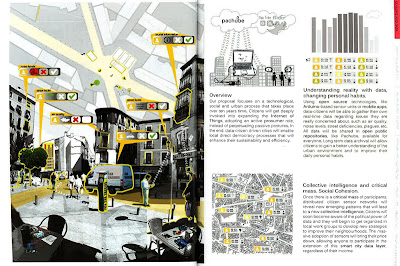
 

Image 2. page 76-77. Honourable Mention- THE DATA-CITIZEN DRIVEN CITY

Image 3. Second prize winner- THE CYBORG LANDSCAPE


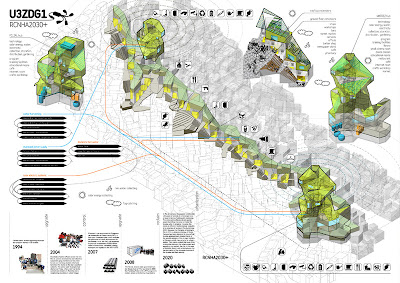
Image 4. Third prize winner- RCNHA 2030+


Image 5. Honourable Mention- 0kWhcity


 The publisher divided competition entry works into six categories: Sensors & Data, Adaptive & Reactive, Behavioural systems, Parametric technology, Social & Collaborative and Theories & Strategies. There are many fresh and fascinating ideas to show various approaches to architectural and urban design. For example, enhancing digital networks in urban areas by social media and applying to urban management, reducing the rate of risky incidences of Chicago through making 1/25 scale testing model of Chicago, creating on-offline network for exchanging second-hand goods and suggestion for architectural system to checking environmental pollution in the site of landfill.

Among lots of entertaining works, Francisco’s work, which is the first prize winner, is outstanding. Francisco Castillo Navarro is an architect and interactive designer. After he graduated from ETSAS and UPF, he set up his own research group: Responsive Environments and has been doing several research projects focus on the urban environment changes.
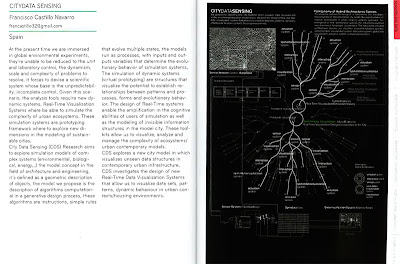


Image 6. pp.82-83. First prize winner– CITY DATA SENSING


Image 7. Panel image of CITY DATA SENSING

 
His idea is to collect invisible but influential data for urban life such as the flows of energy, transportation and economic, and to provide these data with citizen based on real-time. It leads the change of citizen activities and then new information are generated by these changes, as the result, the citizen and the information in urban endlessly foster the interaction between them.
The most participants are bound in physical architectural suggestions as the outcome of the competition; however, Francisco illustrates that integrated system for real-time information, which would stimulate sustainable interactive actions of citizen, could become an aggressive outcome of urban design in the digital era. Unlike other entry works which started from architectural ideas, his approach began from the other fields such as collecting real-time data, visualisation of big data and urban modelling. His final images for the competition could be understood as pretending to describe multiple urban data; however, his actual final work is a movie file to display collecting urban information on tidal system and visualising it.  As the result, other participants demonstrate images and systems at the moment; however, Francisco’s work suggests that the tidal changes of urban information and the visualising structure of real operating situation. Please check his movie image here.  On his blog pages, there are nice information of 3d printing and robotic fabrication as well as his works. Blog1 and Blog2. 
 
The new book of ACTAR is too full of suggestions to regard just the outcome of idea competition. Above all, this book clearly points out that new urban environment based on the rapid developing technologies pushes architects need to collaborate with other fields more than before. It reminds us to consider how the urban environment will be changed by integrated set of information from individuals and institutions, and how new technologies impact on architecture.
Secondly, all winning projects of the competition propose specific own urban system connecting with all urban area not separate buildings. Traditional design approach, which means the sequence of analysing site, finding similar cases, making concept idea, developing mass and building up 3d model, cannot be available anymore for new urban design that needs to understand and develop urban networks and its system.
 
Of course, there are some disappointing parts.
All participants submitted three panel images through the internet, but it is doubtful whether traditional panel images would be applicable to explain invisible flow of data in urban areas or not. As we regard that the real outcome of the first prize winner is a movie image, IAAC needs to revise the format of the submission. On the one hand, there are many fresh ideas and well finished projects. On the other hand, I think the most projects are not far away from pre-existing design methods and are rooted in technical optimism that the city could be effectively controlled by one system. Also, the size of the book is relatively small. It is convenient to carry, but uncomfortable to look at images.
 
But it is obvious to allow this book as a good reference to designate the influence of the technologies on the city and alternative ways of urban design in digital era.
 
The detailed contents and the entry works of last competitions are well arranged on the homepage of IAAC. Please visit there.  
1st competition- Self-Sufficient Housing, 2005http://bit.ly/YMF79q
2nd competition- Self-Sufficient Housing, THE SELF-FAB HOUSE, 2007http://bit.ly/WphN53
3rd competition- THE SELF-SUFFICIENT CITY: Envisioning the habitat of the future, 2009http://bit.ly/13zxrgk
4th competition- THE SELF-SUFFICIENT CITY: Envisioning the habitat of the future, 2011http://bit.ly/Crab7


Basic outcome is below.

Paperback: 368 pages
Publisher: ACTAR / Institut d’Arquitectura Avançada de Catalunya (IAAC)
                 (2 Jan 2013)
Language: English
ISBN-10: 8415391293
ISBN-13: 978-8415391296
Product Dimensions: 16 x 12.2 x 2.3

Continue reading »

Review: City Sense – Shaping our environment with real-time data


Image1. The cover image of ‘City Sense – Shaping our environment with real-time data’

Since 2005, the Institute for Advanced Architecture of Catalonia in Barcelona, which is a provocative architectural school and research institution, has opened architectural competition once in every two years. This competition seeks new types of architectural experiments in the fast changing urban environment and is gaining an international reputation over the world. The most recent competition was held in 2011, and 275 groups participated in from 98 countries. The themes of the competition have expected ideal projections in the future rather than current urban situations; therefore, it is a bit harder to articulate architectural ideas of the themes than other competitions.
 
The book “City Sense – Shaping our environment with real-time data”, which was published by ACTAR, is the outcome of the competition in 2011 and the title of the book is the same as it of the competition. 
 
High speed information and communication technologies have created more possibilities of diversity, mobility and change in the city that comparatively the speed of change is lower than the speed of the technologies by its physical nature. Therefore, urban design and urban planning in the future would claim not traditional approaches for physical urban structure but more and more concerns of immaterial and invisible urban factors based on the development of the technology. In the preface of City Sense, Manuel Gausa, Dean of IAAC, argues that new urban dynamics will emerge from interactive, synchronous and integrated information in multi-level of urban areas, not physical characteristics any more. He explains the purpose of this competition was to find innovative ways of urban design for increasing civic participation, interactive response with the urban environment and real-time information. 
 

Image 2. page 76-77. Honourable Mention- THE DATA-CITIZEN DRIVEN CITY

Image 3. Second prize winner- THE CYBORG LANDSCAPE


Image 4. Third prize winner- RCNHA 2030+


Image 5. Honourable Mention- 0kWhcity


 The publisher divided competition entry works into six categories: Sensors & Data, Adaptive & Reactive, Behavioural systems, Parametric technology, Social & Collaborative and Theories & Strategies. There are many fresh and fascinating ideas to show various approaches to architectural and urban design. For example, enhancing digital networks in urban areas by social media and applying to urban management, reducing the rate of risky incidences of Chicago through making 1/25 scale testing model of Chicago, creating on-offline network for exchanging second-hand goods and suggestion for architectural system to checking environmental pollution in the site of landfill.

Among lots of entertaining works, Francisco’s work, which is the first prize winner, is outstanding. Francisco Castillo Navarro is an architect and interactive designer. After he graduated from ETSAS and UPF, he set up his own research group: Responsive Environments and has been doing several research projects focus on the urban environment changes.


Image 6. pp.82-83. First prize winner– CITY DATA SENSING


Image 7. Panel image of CITY DATA SENSING

 
His idea is to collect invisible but influential data for urban life such as the flows of energy, transportation and economic, and to provide these data with citizen based on real-time. It leads the change of citizen activities and then new information are generated by these changes, as the result, the citizen and the information in urban endlessly foster the interaction between them.
The most participants are bound in physical architectural suggestions as the outcome of the competition; however, Francisco illustrates that integrated system for real-time information, which would stimulate sustainable interactive actions of citizen, could become an aggressive outcome of urban design in the digital era. Unlike other entry works which started from architectural ideas, his approach began from the other fields such as collecting real-time data, visualisation of big data and urban modelling. His final images for the competition could be understood as pretending to describe multiple urban data; however, his actual final work is a movie file to display collecting urban information on tidal system and visualising it.  As the result, other participants demonstrate images and systems at the moment; however, Francisco’s work suggests that the tidal changes of urban information and the visualising structure of real operating situation. Please check his movie image here.  On his blog pages, there are nice information of 3d printing and robotic fabrication as well as his works. Blog1 and Blog2. 
 
The new book of ACTAR is too full of suggestions to regard just the outcome of idea competition. Above all, this book clearly points out that new urban environment based on the rapid developing technologies pushes architects need to collaborate with other fields more than before. It reminds us to consider how the urban environment will be changed by integrated set of information from individuals and institutions, and how new technologies impact on architecture.
Secondly, all winning projects of the competition propose specific own urban system connecting with all urban area not separate buildings. Traditional design approach, which means the sequence of analysing site, finding similar cases, making concept idea, developing mass and building up 3d model, cannot be available anymore for new urban design that needs to understand and develop urban networks and its system.
 
Of course, there are some disappointing parts.
All participants submitted three panel images through the internet, but it is doubtful whether traditional panel images would be applicable to explain invisible flow of data in urban areas or not. As we regard that the real outcome of the first prize winner is a movie image, IAAC needs to revise the format of the submission. On the one hand, there are many fresh ideas and well finished projects. On the other hand, I think the most projects are not far away from pre-existing design methods and are rooted in technical optimism that the city could be effectively controlled by one system. Also, the size of the book is relatively small. It is convenient to carry, but uncomfortable to look at images.
 
But it is obvious to allow this book as a good reference to designate the influence of the technologies on the city and alternative ways of urban design in digital era.
 
The detailed contents and the entry works of last competitions are well arranged on the homepage of IAAC. Please visit there.  
1st competition- Self-Sufficient Housing, 2005http://bit.ly/YMF79q
2nd competition- Self-Sufficient Housing, THE SELF-FAB HOUSE, 2007http://bit.ly/WphN53
3rd competition- THE SELF-SUFFICIENT CITY: Envisioning the habitat of the future, 2009http://bit.ly/13zxrgk
4th competition- THE SELF-SUFFICIENT CITY: Envisioning the habitat of the future, 2011http://bit.ly/Crab7


Basic outcome is below.

Paperback: 368 pages
Publisher: ACTAR / Institut d’Arquitectura Avançada de Catalunya (IAAC)
                 (2 Jan 2013)
Language: English
ISBN-10: 8415391293
ISBN-13: 978-8415391296
Product Dimensions: 16 x 12.2 x 2.3

Continue reading »

Paper published in PLOS ONE

Forget Social Networks, our names link us together in cultural and ethnic communities worldwide Our forenames and surnames are connected into distinct global networks of cultural, ethnic and linguistic communities. These are revealed for the first time y a team … Continue reading

Continue reading »

Workshop- Mapping Social Interactions Online, Oxford Internet Institute


Last Friday (9thMarch), Oxford Internet Institute (OII) opened Internet research methodology workshop- Mapping Social Interactions Online at OII seminar room. It was one of OII’s successive workshop ‘Beyond Survey’ in 2011-2012.
This workshop was mainly composed of two parts. Dr Mark Graham led one part with the topic of Mapping with GIS and Dr Sandra Gonzalez-Bailon gave a lecture of social networks. Because the most participants are doing interdisciplinary researches which have a link to internet studies and they might not know well the methodologies of the studies, two lecturers introduced fundamental information and some basic program tools for further researches.
The research interest of Dr Mark Graham could be understood as ‘Intersection between ICT (Internet Communication Technology) and Geography’. He introduced GIS to catch and visualize invisible internet flows and social networks, and explained the concept of projection, the difference between Quantitative map and Qualitative map and some kinds of GIS programmes. While some professional GIS programmes like Arc GIS need a certain period of time to learn and utilize it, online mapping sites are more accessible for researchers and easy to create a map, therefore, he showed some online GIS websites and gave a demonstration to make a mapping on Google map by BatchGeo.com.
Below lists are the programmes and the sites which he mentioned during his lecture.

Arc GIS, Quantum GIS, TileMill, Geodesix, Mango Map, Geo IQ, BatchGeo

If you would like to know more about GIS, CASA website and their blogs should be useful.
Dr Sandra Gonzalez-Bailon provided a brief lecture about the structure of social networks. She drew simple but crucial questions like ‘What makes online networks different from offline networks?’ before starting a presentation, and she tried to resolve the questions. After introducing a historical timeline of network research, the importance of different social networks within one society and its meaning were suggested. During the lecture, she emphasized the implication what lies behind networks with multiple components and innumerable relationships of networks, and how characteristics of networks can be changed by these things. Like Dr Mark Graham, she showed some software to analyse online social networks and references which contain the contents of network theory.
The lists are below:

Social network analysis : methods and applications (1994)

Networks, Crowds, and Markets: Reasoning About a Highly Connected World (2010)

Networks: An Introduction (2010)

Exploratory Social Network Analysis with Pajek (2005)

Understanding Social Networks: Theories, Concepts, and Findings (2012)

NodeXL, Pajek, igraph,


This workshop was a good opportunity to know different approaches toward a similar topic not only research methodology but also its theoretical backgrounds. The lectures were energetic and provided interactive presentations. Some participants might want to see practical research processes of OII and how these methodologies can apply to their researches such as visualizing a relationship between online social interactions and geographical location. But, the lecturers agreed visualizing the relationship, which is my best attractive point, is a perplexing process and it needs a further development.

Continue reading »

Workshop- Mapping Social Interactions Online, Oxford Internet Institute


Last Friday (9thMarch), Oxford Internet Institute (OII) opened Internet research methodology workshop- Mapping Social Interactions Online at OII seminar room. It was one of OII’s successive workshop ‘Beyond Survey’ in 2011-2012.
This workshop was mainly composed of two parts. Dr Mark Graham led one part with the topic of Mapping with GIS and Dr Sandra Gonzalez-Bailon gave a lecture of social networks. Because the most participants are doing interdisciplinary researches which have a link to internet studies and they might not know well the methodologies of the studies, two lecturers introduced fundamental information and some basic program tools for further researches.
The research interest of Dr Mark Graham could be understood as ‘Intersection between ICT (Internet Communication Technology) and Geography’. He introduced GIS to catch and visualize invisible internet flows and social networks, and explained the concept of projection, the difference between Quantitative map and Qualitative map and some kinds of GIS programmes. While some professional GIS programmes like Arc GIS need a certain period of time to learn and utilize it, online mapping sites are more accessible for researchers and easy to create a map, therefore, he showed some online GIS websites and gave a demonstration to make a mapping on Google map by BatchGeo.com.
Below lists are the programmes and the sites which he mentioned during his lecture.

Arc GIS, Quantum GIS, TileMill, Geodesix, Mango Map, Geo IQ, BatchGeo

If you would like to know more about GIS, CASA website and their blogs should be useful.
Dr Sandra Gonzalez-Bailon provided a brief lecture about the structure of social networks. She drew simple but crucial questions like ‘What makes online networks different from offline networks?’ before starting a presentation, and she tried to resolve the questions. After introducing a historical timeline of network research, the importance of different social networks within one society and its meaning were suggested. During the lecture, she emphasized the implication what lies behind networks with multiple components and innumerable relationships of networks, and how characteristics of networks can be changed by these things. Like Dr Mark Graham, she showed some software to analyse online social networks and references which contain the contents of network theory.
The lists are below:

Social network analysis : methods and applications (1994)

Networks, Crowds, and Markets: Reasoning About a Highly Connected World (2010)

Networks: An Introduction (2010)

Exploratory Social Network Analysis with Pajek (2005)

Understanding Social Networks: Theories, Concepts, and Findings (2012)

NodeXL, Pajek, igraph,


This workshop was a good opportunity to know different approaches toward a similar topic not only research methodology but also its theoretical backgrounds. The lectures were energetic and provided interactive presentations. Some participants might want to see practical research processes of OII and how these methodologies can apply to their researches such as visualizing a relationship between online social interactions and geographical location. But, the lecturers agreed visualizing the relationship, which is my best attractive point, is a perplexing process and it needs a further development.

Continue reading »
1 2