|
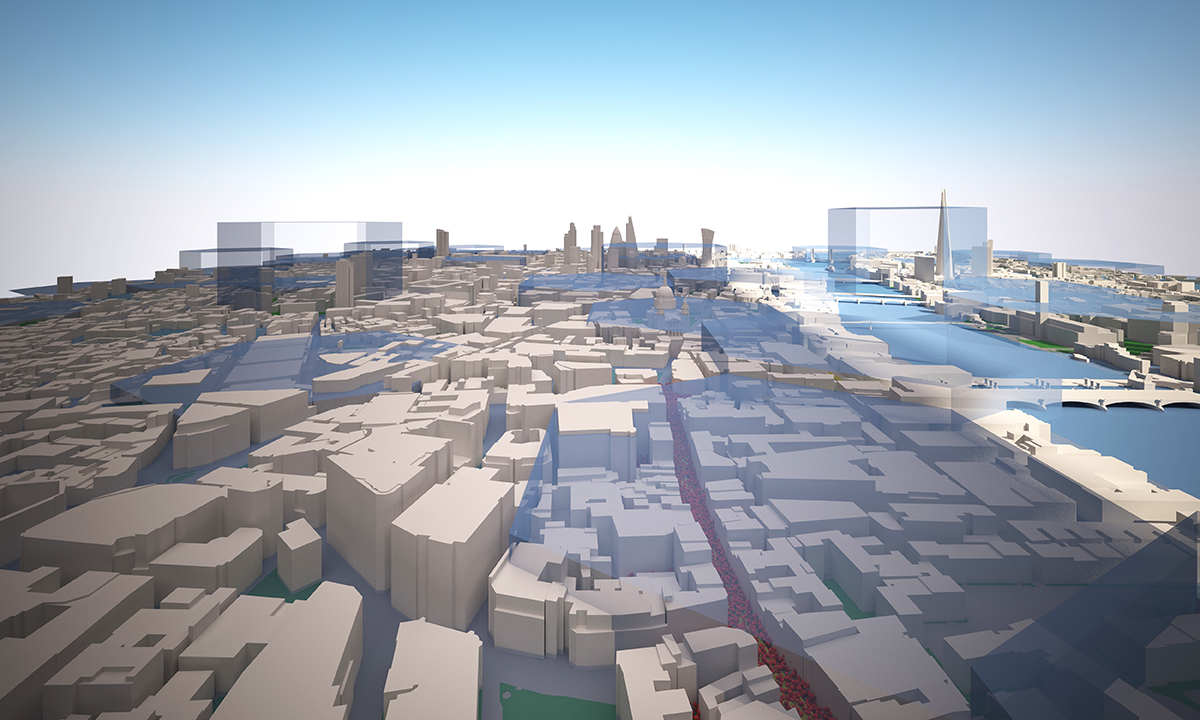
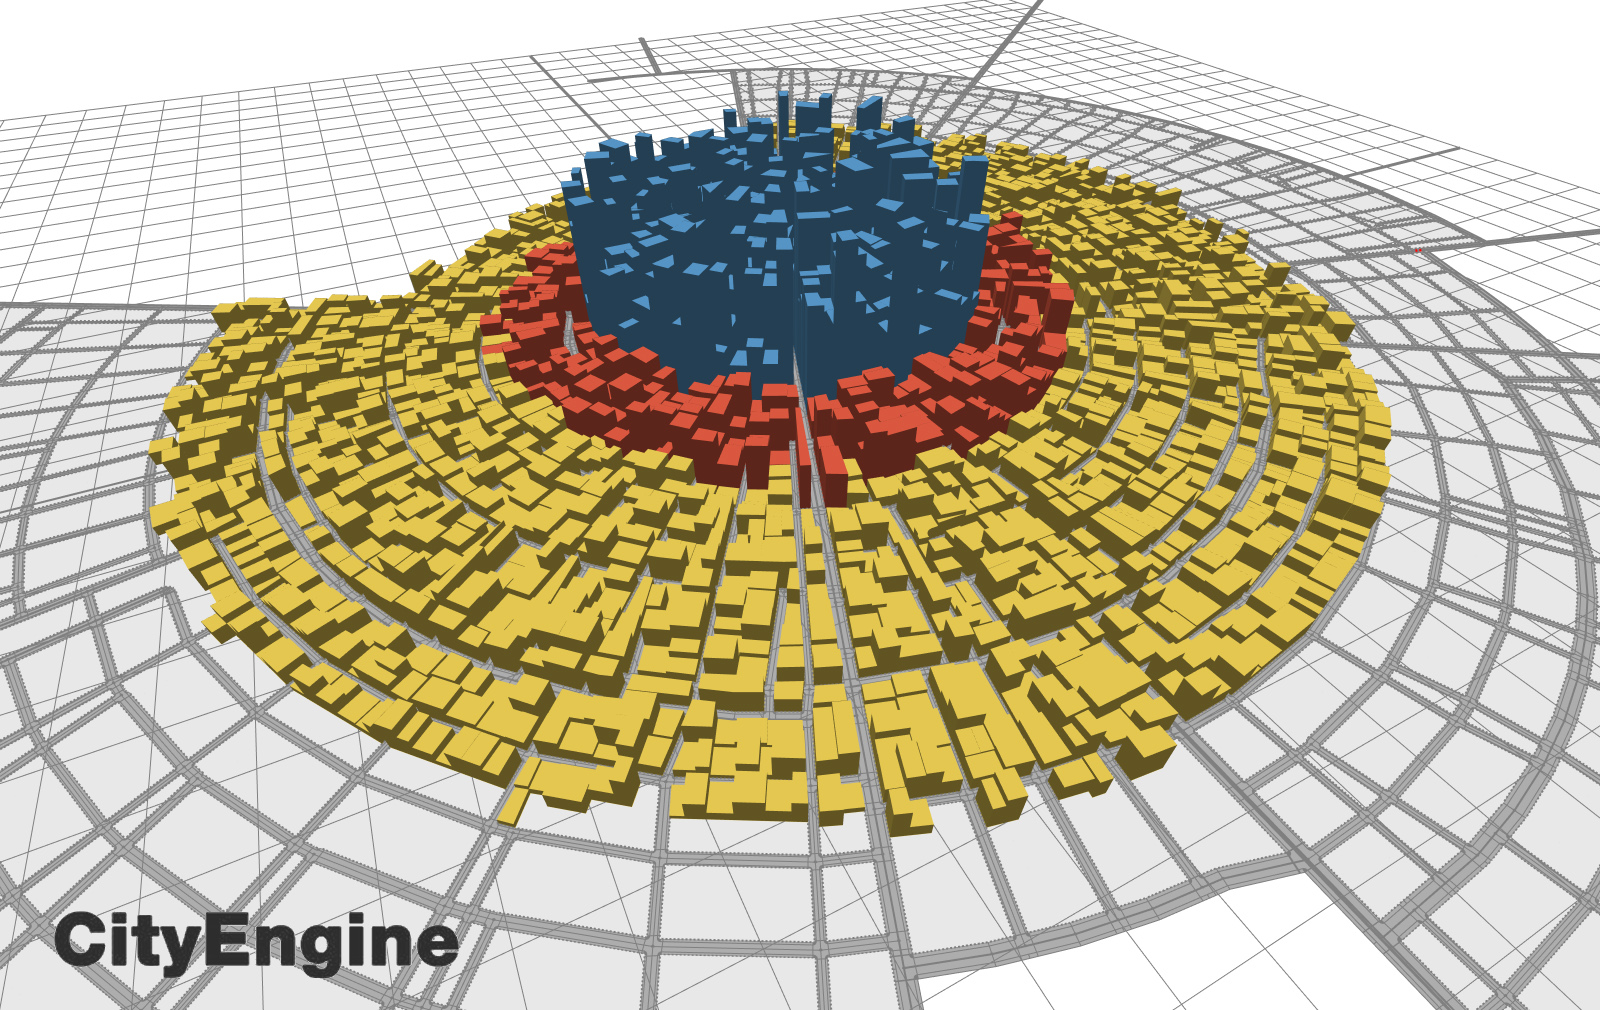
| The Roman Road network 410AC, as a floating layer over contemporary London in 3D. |
How did London become what it is today? How did it evolve and why? It is widely known that London is a historical city. One that has been inhabited for over 1500 years. What most people don’t know however, is that the greatest preserved feature of the city, is the road network itself. Unlike other historical cities such as Athens or Rome where there is an obvious patchwork of areas of different periods, London’s scheduled sites and listed buildings are individual structures, in many cases assembled gradually by parts from many different periods. Those who tried to locate different historic structures will know that these features appear as pieces of different puzzles, scattered within the vast fabric of the contemporary city. What has been preserved, and what will we preserve in the future?
The London Evolution Animation (LEA) was developed by The Bartlett Centre for Advanced Spatial Analysis (UCL), as a partnership project between English Heritage, The Centre for Smart Infrastructure and Construction (University of Cambridge)/Dr Kiril Stanilov and Museum of London Archaeology (MOLA) (with the Mapping London and Locating London’s Past projects), and was initiated and directed by Polly Hudson (PHD).
The London Evolution Animation for the first time, brings together and shows the historical development of London from Roman times to today, through the evolution of the road network and preserved structures of the built environment. The information is categorized by periods and the new road segments appear gradually over an image of the faded contemporary London. For each period, gradually enlarging yellow points highlight the position and number of statutorily protected buildings and structures. Datasets cover London’s 19,000 Listed Buildings and 156 Scheduled Monuments which are categorized by period (listed date) and integrated into the animation. LEA brings together datasets provided by English Heritage’s
National Heritage List for England, MOLAS, University of Cambridge -Dr. Kiril Stanilov and Ordnance Survey. Originally, LEA was meant to be developed fully in 3D, which is an ongoing project.
A series of digital pictures showcase the what if scenarios of developments in London that were never realized, while 3D animations of London’s history of the built environment explain more about the city’s architectural heritage.
The exhibition is found online in Polly’s Hudson Almost Lost online and its a great showcase of London’s historic wealth. Further information on the Animation, a historical overview and on the production of the video can also be found in Polly’s Hudson website.
List of References:
A. Paolo Masucci, Kiril Stanilov and Michael Batty (2013) The growth of London’s street network in its dual representation http://www.bartlett.ucl.ac.uk/casa/publications/working-paper-189
CASA UCL: http://www.bartlett.ucl.ac.uk/casa
MOLA: http://www.museumoflondonarchaeology.org.uk/NewsProjects/Current-News/LondonEvolutionAnimation.htm
Cambridge: http://www-smartinfrastructure.eng.cam.ac.uk/
English Heritage: http://www.english-heritage.org.uk/
Continue reading »