
Latest Posts
Geodesign
Presenting this morning at ESRI Geodesign Summit with the title Simulating Geodesign: Agents as Designers, Agents as Buildings. Click on the pdf to get a sense of what this is about. Most geodesign is the application of spatial analytics and … Continue reading →
Continue reading »D3 Graph Problems
My last post on the delays caused by the snow contained a comment about a bug in the D3 library. Not wanting to just leave this, I’ve done some more testing with the latest D3 code. As can be seen from the graph below, something corrupts the x coordinate in the SVG path: On …
Read more →
Science for everyone by everyone – the re-emergence of citizen science
Earlier this week, I gave a public lecture as part of UCL‘s programme of Lunch Hour Lectures. The talk, which is titled ‘Science for everyone by everyone – the re-emergence of citizen science‘ covered the area of citizen science and explained what we are trying to achieve within the Extreme Citizen Science research group. Because […]![]()

The Big Egg Hunt Maps
I somehow missed, until now, this set of oblique-projec […]
Continue reading »
From Growth To Equilibrium – The work of Jay W. Forrester
The number of times you read a paper which seriously affects the way you view the world is depressingly low in the development business. Papers focus on the small-scale (does buying more text books improve test scores?) instead of the … Continue reading →
Continue reading »Real Time City Data
With the recent snow in London, we’ve been looking at real-time sources of transport data with a view to measuring performance. The latest idea was to use flight arrivals and departures from Heathrow, Gatwick and City to measure what effect snow had on operations. The data for Heathrow is shown below: Arrivals and departures data …
Read more →
BSPS 2013 – Call for Papers
TweetBSPS Annual Conference 2013 Monday 9 – Wednesday 11 September 2013, University of Swansea CALL FOR PAPERS: DEADLINE 25 MARCH. The 2013 BSPS Conference will be held at the University of Swansea, 9-11 September. All Conference sessions will be held on site, where Conference catering and accommodation will also be available at […]
Continue reading »Enough to reduce global poverty four times over
Today counts as an exciting day in the life of a researcher whose reading list consists more of Twitter and blogs than it does of JDE papers. (Should I be admitting to this in public? Something about the narrow micro-focus … Continue reading →
Continue reading »The spatial distribution of human development
Let me get a quick admission out of the way, before I launch into this review of the freshly-published World Development article Using Census Data to Explore the Spatial Distribution of Human Development by Iñaki Permanyer: I don’t know much … Continue reading →
Continue reading »Smart Cities Lectures Online
It is a bit of a gamble to tell those who watch our CASA site that I have just started a new lecture course on Smart Cities that I am offering to graduates at ASU. A gamble because Smart Cities … Continue reading →
Continue reading »Knowing What We Can
A recent blog post of mine got all lathered up about the work of Toby Ord‘s charity-bothering organisation Giving What We Can. (Note: from the pictures on their website it seems that there are other people involved, but calling it … Continue reading →
Continue reading »

Urban rambles: the “green” way
Don’t walk the Greenway unless you like the smell of sewage. Let me rephrase that: unless you can tolerate the smell of sewage, a bit. I can’t think of many people who actively enjoy the smell of sewage*. Let me … Continue reading →![]()
Sen is everywhere
I’m sure I’m not the only one to have had a hard time reading Amartya Sen’s Development as Freedom* on the tube or in a cafe. It’s serious reading and requires a suitably contemplative atmosphere to avoid the dreaded “I’ve … Continue reading →
Continue reading »CASA’s Focus on Big Data
Here is a short one page missive from me printed in this month’s (January 2013) issue of Geographical (magazine) which argues the case for getting involved in these questions. Can’t find the online content (and we don’t seem to have … Continue reading →
Continue reading »London Underground: 14 alternative Tube maps
London Underground’s Tube map has been used as a metaphor for everything from the shape of the galaxy to famous footballers.See it on Scoop.it, via Spatial Analysis
Continue reading »London Underground: 14 alternative Tube maps
London Underground’s Tube map has been used as a metaphor for everything from the shape of the galaxy to famous footballers.See it on Scoop.it, via Spatial Analysis
Continue reading »
История метро началась с лондонской подземки – BFM.Ru
 BFM.Ru |
История метро началась с лондонской подземки
BFM.Ru Кроме того, это ценный аналитический инструмент. Так, Центр пространственного анализа University College London (Centre for Advanced Spatial Analysis, CASA) «читает» структуру города по пропускной нагрузке терминалов для транспортных … |

Google Doodle for London Underground’s 150th Anniversary
Google has replaced their normal logo with a special “Doodle” for today, celebrating the 150th Anniversary of the London Underground today. The graphic is a stylised version of the iconic…
Continue reading »UNITY 3D – The infinite museum
In the 2011-2012 MRes of Advanced Spatial Analysis and Visualization we worked on some fascinating topics and new year is always a good time to re-cap. The Infinite museum is the result of an interdisciplinary collaboration with Martin D…
Continue reading »
UNITY 3D – The infinite museum

In the 2011-2012 MRes of Advanced Spatial Analysis and Visualization we worked on some fascinating topics and new year is always a good time to re-cap. The Infinite museum is the result of an interdisciplinary collaboration with Martin Dittus, Ian Morton, Mohammad Masum and myself, for the design of a virtual exhibition space, as a showcase for a constantly updating database of different visualization techniques. The first question that emerged in this case, was why build a spatial structure for the presentation of a-spatial information. In this case the answer is conceptual.
In 1929, Le Corbusier designed the Museum of Unlimited Growth (Musée à croissance illimitée) for the Mundaneum in Geneva. He imagined a square spiral that would develop and grow infinitely in time. In his vision, visitors would follow a path which would let them explore exhibits via a continuous circulation, allowing them to experience what he called a “promenade architectural” (an architectural walk). Despite its utopic nature, the vision behind this concept is the realization of an era of constant change and non-permanence, followed by an optimism of continuous growth.
Later, the idea of “virtuality” provoked an even more interesting swift in planning and design with the emergence of parametric modelling, sensors and new interaction techniques, which allowed new notions, e.g gaming, to become an active player in the design process. This awareness became an inspiration for the development of new solutions, such as the experimental project Arctic Research Facility by Polar Ants for building structures in constantly fluctuating physical surroundings. Or even projects which address to philosophical questions, as in the case of the Lotus Dome by studio Roosegaarde, in whether technology can be sacred.
 |
| The museum of Unlimited Growth – Le Corbusier 1929 |
In continuance to these ideas, the Infinite Museum, is an interactive application that allows players to visually explore exhibits (images, movies, 3D models, animated objects) and the complex network of relations between them. The project, follows the inspiration of unlimited growth museum, with the difference that in this case, it moves away from the traditional 3d exhibition spaces which rely on a pre-built structure with a “continuous” or a tree- type “network” circulation. Instead, the Infinite Museum explores the possibilities of modular construction and dynamically constructs a map of rooms whose topology is a result of both player choices and pre-defined exhibit relationships.
The idea is to create a typical spatial structure of an exhibition space which will be augmented with the ideas of Web3 such as the use of a cloud network for categorizing the exhibits and guiding the viewer. 3D “types of rooms” connect to each other, in order to create a sequence of spaces that will guide the viewer through the exhibition, while providing him the choices of the cloud network. The user becomes the curator, who structures the exhibition, not by designing it, but by choosing types or “tags” of exhibits and therefore, he is more likely to run into the exhibits that are more related to his group of preferences.
This is a UNITY 3D application, which includes assets built in a range of 3D modeling software packages. Unity, as a game engine, provides excellent tools for interactive 3d space as well as the possibility for developing interesting multi-player game-play.
 |
| The infinite museum is a showcase for a range of visualization techniques such as images, videos, 3d objects and 3d animations. |
 |
| The application explores the possibilities of modular construction |
 |
| The application doesn’t rely on a pre-built structure, instead it dynamically creates a map of rooms whose topology is a result of player options and pre-defined exhibit relationships. |
In terms of typology, the rooms of the Infinite Museum are especially designed so as to be “convex”, meaning they all connect seamlessly, and in their combination fully cover a 2D area. The impression in this case, is not a sequence of rooms, but more of a collection of infinite spaces. Very much like a puzzle with different pieces that are all linkable to each other. In that way there are 6*6*4= 144 possible connections and therefore 144 different spaces generated by just 6 cubic rooms.
 |
| The 6 rooms of the infinite museum |
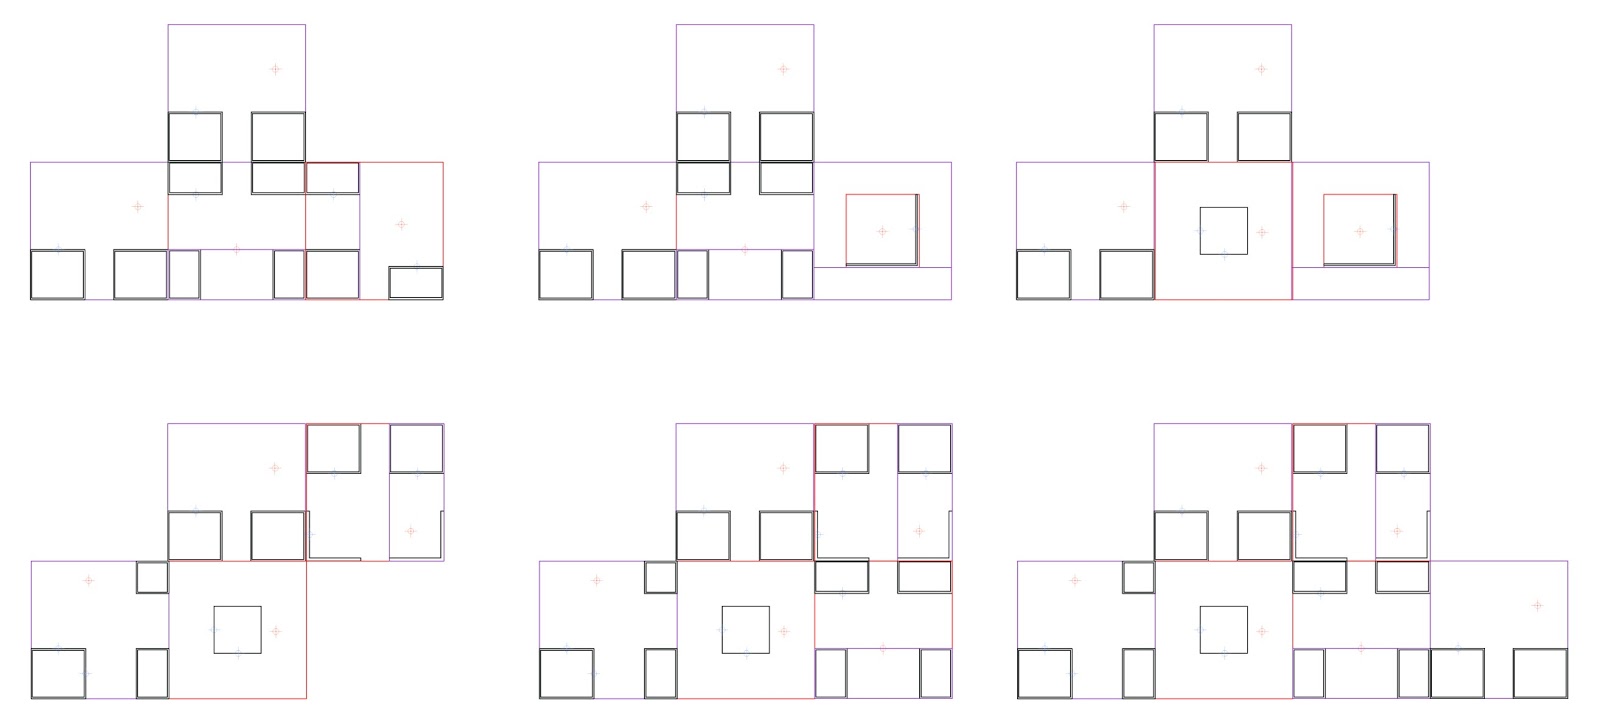 |
| The generation of different spaces is illustrated above using random formations. |
At this point the project is aimed to be a tool for the collection and presentation of different visualization works. Textures and lighting are defaulted and flexible for further development as the game play progresses. Next steps include texture and pattern design, association of spatial items with exhibit tags, real time shadows and interactions, game-play development and the introduction of multi-players.
The exhibition incorporates visualizations that were produced as part of taught courses, while the project itself was made in the context of the visualization course by Andrew Hudson Smith and Martin Austwick, in the MRes ASAV 2011.
This blogpost contains extracts from our group essay.
Team Members, visit their blogs at:
Martin Dittus COVSPC
Ian Morton visual metro
Mohammad Masum Spatial Urban
Flora Roumpani En-topia

UNITY 3D – The infinite museum
In the 2011-2012 MRes of Advanced Spatial Analysis and Visualization we worked on some fascinating topics and new year is always a good time to re-cap. The Infinite museum is the result of an interdisciplinary collaboration with Martin Dittus, Ian Morton, Mohammad Masum and myself, for the design of a virtual exhibition space, as a showcase for a constantly updating database of different visualization techniques. The first question that emerged in this case, was why build a spatial structure for the presentation of a-spatial information. In this case the answer is conceptual.
In 1929, Le Corbusier designed the Museum of Unlimited Growth (Musée à croissance illimitée) for the Mundaneum in Geneva. He imagined a square spiral that would develop and grow infinitely in time. In his vision, visitors would follow a path which would let them explore exhibits via a continuous circulation, allowing them to experience what he called a “promenade architectural” (an architectural walk). Despite its utopic nature, the vision behind this concept is the realization of an era of constant change and non-permanence, followed by an optimism of continuous growth.
Later, the idea of “virtuality” provoked an even more interesting swift in planning and design with the emergence of parametric modelling, sensors and new interaction techniques, which allowed new notions, e.g gaming, to become an active player in the design process. This awareness became an inspiration for the development of new solutions, such as the experimental project Arctic Research Facility by Polar Ants for building structures in constantly fluctuating physical surroundings. Or even projects which address to philosophical questions, as in the case of the Lotus Dome by studio Roosegaarde, in whether technology can be sacred.
|
| The museum of Unlimited Growth – Le Corbusier 1929 |
In continuance to these ideas, the Infinite Museum, is an interactive application that allows players to visually explore exhibits (images, movies, 3D models, animated objects) and the complex network of relations between them. The project, follows the inspiration of unlimited growth museum, with the difference that in this case, it moves away from the traditional 3d exhibition spaces which rely on a pre-built structure with a “continuous” or a tree- type “network” circulation. Instead, the Infinite Museum explores the possibilities of modular construction and dynamically constructs a map of rooms whose topology is a result of both player choices and pre-defined exhibit relationships.
The idea is to create a typical spatial structure of an exhibition space which will be augmented with the ideas of Web3 such as the use of a cloud network for categorizing the exhibits and guiding the viewer. 3D “types of rooms” connect to each other, in order to create a sequence of spaces that will guide the viewer through the exhibition, while providing him the choices of the cloud network. The user becomes the curator, who structures the exhibition, not by designing it, but by choosing types or “tags” of exhibits and therefore, he is more likely to run into the exhibits that are more related to his group of preferences.
This is a UNITY 3D application, which includes assets built in a range of 3D modeling software packages. Unity, as a game engine, provides excellent tools for interactive 3d space as well as the possibility for developing interesting multi-player game-play.
|
| The infinite museum is a showcase for a range of visualization techniques such as images, videos, 3d objects and 3d animations. |
|
| The application explores the possibilities of modular construction |
|
| The application doesn’t rely on a pre-built structure, instead it dynamically creates a map of rooms whose topology is a result of player options and pre-defined exhibit relationships. |
In terms of typology, the rooms of the Infinite Museum are especially designed so as to be “convex”, meaning they all connect seamlessly, and in their combination fully cover a 2D area. The impression in this case, is not a sequence of rooms, but more of a collection of infinite spaces. Very much like a puzzle with different pieces that are all linkable to each other. In that way there are 6*6*4= 144 possible connections and therefore 144 different spaces generated by just 6 cubic rooms.
|
| The 6 rooms of the infinite museum |
|
| The generation of different spaces is illustrated above using random formations. |
At this point the project is aimed to be a tool for the collection and presentation of different visualization works. Textures and lighting are defaulted and flexible for further development as the game play progresses. Next steps include texture and pattern design, association of spatial items with exhibit tags, real time shadows and interactions, game-play development and the introduction of multi-players.
The exhibition incorporates visualizations that were produced as part of taught courses, while the project itself was made in the context of the visualization course by Andrew Hudson Smith and Martin Austwick, in the MRes ASAV 2011.
This blogpost contains extracts from our group essay.
Team Members, visit their blogs at:
Martin Dittus COVSPC
Ian Morton visual metro
Mohammad Masum Spatial Urban
Flora Roumpani En-topia
A visit to Lab 13 and the Science Songwriters of the Future!!!!
It’s high time I wheeled out my annual academic New Year’s Resolutions (if you think most people’s nyrs are predictable, read some academics’ – this year I’ll try to go beyond the litany of “Read more. Write more. Apply for … Continue reading →![]()
Wicked Problems
40 years ago, Horst Rittel and Mel Webber published their seminal article entitled Dilemmas in a General Theory of Planning. In it, they argued that many, if not most, problems in cities that planners were engaged in ‘solving’, tended to … Continue reading →
Continue reading »PopGRG sponsored sessions for RGS-IBG annual conference: call for papers
TweetThe Population Geography Research Group of the RGS-IBG are delighted to announce our sponsored sessions for the Royal Geographical Society with the Institute of British Geographers annual conference, to be held at the RGS-IBG headquarters (Kensington Gore, London) on Wednesday 28th to Friday 30th August. Sessions and abstracts are listed below. Should you […]
Continue reading »Writing about datavis: fishing about architecture
Musician Frank Zappa famously coined the phrase “talking about music is like fishing about architecture” – a statement that surely applies just as well to visual design. Luckily, datavis is of a more analytical, logic-and-language bent, so we can start … Continue reading →![]()
Economic Growth, Smart Cities
Robert Gordon of Northwestern University argues that we are coming to the end of more than 200 years of rapid growth in GDP. The third industrial revolution after steam which was the first, and electricity and chemistry, the second, and … Continue reading →
Continue reading »Shortest network path calculation
Interactive version (currently Chrome or Safari only) A basic algorithm to calculate the shortest path through random networks between 2 nodes (without passing the same node twice). Networks with a higher ratio of connections to nodes (especially where connections cross each other) contain exponentially more possible paths. The algorithm uses a recursive nested logical process […]
Continue reading »Modelling on the Move
Dave Banister’s group at Oxford have just started a seminar series on new approaches to transport and mobility modelling called “Modelling on the Move” and two of us from UCL, myself and Peter Jones from the Centre for Transport Studies talked … Continue reading →
Continue reading »
London Christmas Map
This is a view from the LondonTown Christmas Map. While […]
Continue reading »
Me, Geolocated on Twitter
I was prompted by the excellent Twitter Tongues map, where geolocated tweets in London (including mine, and those from hundreds of thousands of others) were mined by Ed Manley over the summer, and then mapped by James Cheshire, to see … Continue reading →
Continue reading »PhD Studentships at LSHTM
TweetESRC Studentships at the London School of Hygiene and Tropical Medicine We are accepting applications now for social science and public health PhD and MSc funding ESRC 1+3 studentships are available in the Faculty of Epidemiology & Population Health and theFaculty of Public Health & Policy for social science research in the following areas: Demography – Demography & Health; […]
Continue reading »Visualisations of Realtime City Transport Data
Over the last few weeks I’ve been building systems to collect realtime city data including tubes, buses, trains, air pollution, weather data and airport arrivals/departures. Initially this is all transport related, but the idea is to build up our knowledge of how a city evolves over the course of a day, or even a week, …
Read more →
The Strange Non-Referential Domain of Morphology
How is that a niche research area such as the shape and form of cities using various mathematical and formal principles in geometry, allometry, scaling and social physics can have several distinct approaches that never refer to one another? Fractals … Continue reading →
Continue reading »
Fusing remote sensing with demographic data for synthetic population generation

When building agent-based models related to “real” world locations and people, the challenge is to build agents which resemble people on the ground. I have blogged about microsimulation approaches before and their utility with respect to agent-based models. A new paper in the International Journal of Geographical Information Science by alumnae from the Department of Computational Social Science here at GMU have developed a new algorithm which could prove useful. Below is abstract of the paper:
We develop a new algorithm for population synthesis that fuses remote-sensing data with partial and sparse demographic surveys. The algorithm addresses non-binding constraints and complex sampling designs by translating population synthesis into a computationally efficient procedure for constrained network growth. As a case, we synthesize the rural population of Afghanistan, validate the algorithm with in-sample and out-of-sample tests, examine the variability of algorithm outputs over k-nearest neighbor manifolds, and show the responsiveness of our algorithm to additional data as a constraint on marginal population counts.
Full Reference:
Rizi, S.M.M., Łatek, M.M. and Geller, A. (2012), ‘Fusing Remote Sensing with Sparse Demographic Data for Synthetic Population Generation: An Algorithm and Application to Rural Afghanistan’, International Journal of Geographical Information Science, DOI:10.1080/13658816.2012.734825.
Continue reading » 
Fusing remote sensing with demographic data for synthetic population generation
When building agent-based models related to “real” world locations and people, the challenge is to build agents which resemble people on the ground. I have blogged about microsimulation approaches before and their utility with respect to agent-based models. A new paper in the International Journal of Geographical Information Science by alumnae from the Department of Computational Social Science here at GMU have developed a new algorithm which could prove useful. Below is abstract of the paper:
We develop a new algorithm for population synthesis that fuses remote-sensing data with partial and sparse demographic surveys. The algorithm addresses non-binding constraints and complex sampling designs by translating population synthesis into a computationally efficient procedure for constrained network growth. As a case, we synthesize the rural population of Afghanistan, validate the algorithm with in-sample and out-of-sample tests, examine the variability of algorithm outputs over k-nearest neighbor manifolds, and show the responsiveness of our algorithm to additional data as a constraint on marginal population counts.
Full Reference:
Rizi, S.M.M., Łatek, M.M. and Geller, A. (2012), ‘Fusing Remote Sensing with Sparse Demographic Data for Synthetic Population Generation: An Algorithm and Application to Rural Afghanistan’, International Journal of Geographical Information Science, DOI:10.1080/13658816.2012.734825.
Continue reading » 
Paris Workshop on Bike Sharing Systems
I attended a one-day workshop last week, hosted by IFSTTAR’s GERI Animatic research group at École des Ponts ParisTech just east of Paris. The workshop was on Bicycle Sharing Systems, and as I have recently been working with a couple … Continue reading →
Continue reading »