|
| Cover page of Basics Landscape Architecture 01: Urban Design |
When I was an architectural student for my bachelor, nobody told me and taught me about urban theory and urban design. And it became the main reason why I started to learn urban studies in London after some years.
When I attended the first design class for designing house and small building in the school, professors pushed us to consider the meanings of architecture and home, the difference between public space and private space, the characteristics of users, design methods and so on. Several good references were introduced as well.
However, the next semester after the house design, still I had not enough to finalize one mass or one building, I was thrown into ‘urban’ and had to design the building in the context of urban and urban itself.
In the beginning, it was very exciting to make something new in large and complex area by myself. But, in an instant, I realized it is really difficult to distinguish what I have to consider, how I analyze urban aspects, how the aspects could be led to design materials and what urban really is. Nobody told me and it was hard to find something what exactly explains the way of urban design. Furthermore, the embarrassment by jumping into large scale from small level was tantamount to facing a great wall.
At that time, I was thinking that ‘Is there any readable book to show the guideline of urban design?’. I believe other people who studied or have been studying urban design at the department of architecture might suffer similar experience with me.
‘Basics Landscape Architecture 01: Urban Design’ from AVA Publishing should be a good reference for people who have the same problem what I had before. This book is composed of six chapters: What is Urban Design?, Context, Measure, Movement, Community and Culture, Projects and Processes. Each chapter provides the meaning of the title, summarizes main issues and spreads out relevant examples.
Like other basic series of AVA Publishing, it provides general knowledge of urban design with core issues, key individuals and good design examples for beginner, rather than deep-abundant thought for broader discussion.
In fact, many elements of the contents are complicated and vague to define each meaning and suggest compatible cases; therefore, the frantic effort of the authors which translates to comfortable language would be respectable.
 |
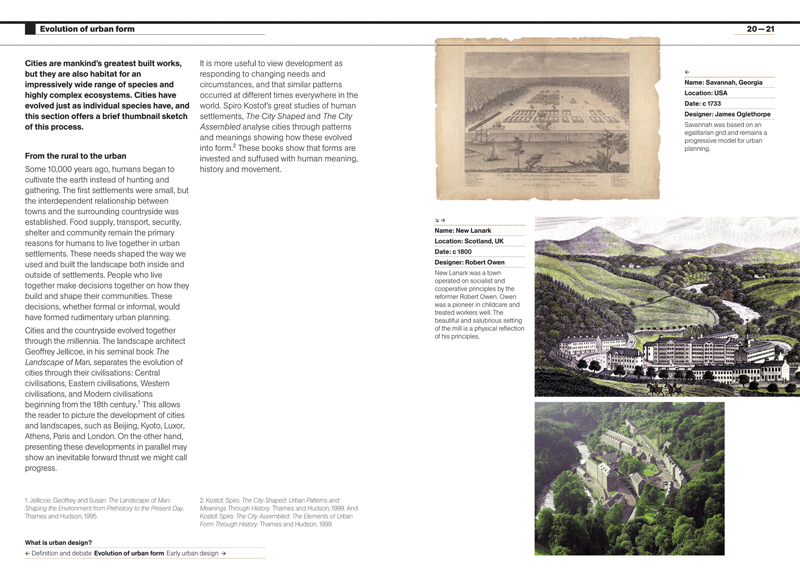
| Page 20-21: Evolution of urban form |
For example, this book sums up urban growth as a chain of events : clusters of dwellings – City walls – Sprawl – massive growth in the industrial age – new urban forms (even it would be too simplified), and the authors argue that recent urban growth should be focused on not physical land expansion but social facts such as international migration.
The best point of this book is to excite curiosity of readers and stimulate finding key issues, individuals and cities. In my case, I took an interest again in grid system which is the oldest method of urban design. Grid system has been developed since Ancient Greece and was intensely used by Roman Empire. It was not just a tool for construction of new city but a symbol of their domination over nature as well as imperial power. Personally, I have been interested in the grid structure of cities such as Barcelona, New york and some Korean modern cities. After reading the part of the grid, ‘The City Shaped: Urban Patterns and Meanings Through History’ was borrowed from library and unfolded additional texts.
 |
| Page 143: Structure-Barcelona Grid
|
Also, the book mentions how urban elements can be developed as the main design concept and how it leads the project. The last chapter of the book, Projects and Processes, introduces five basic elements of urban design: Structure, Line, Point, Beyond and Green, and briefly provides some examples. In the case of Line, the authors insist that lines in urban projects occasionally represent the movements in urban areas. Complex urban scenarios and expanding urban movements in cities can be organized by infusing conscious lines into the projects such as the cases of Barcelona, New York and Hong Kong.
 |
| Page 148-149: Case Study-High Line
|
 |
| Page 150-151: Case Study-Euralille
|
Total 170 pages with many images is not a big burden as the first step of urban design, so the book is recommendable for students who just started studying urban design such as 3rd year or intermediate course students.
Basics Landscape Architecture 01: Urban Design
Paperback: 184 pages
Publisher: Ava Publishing (Oct 2009)
Language: English
ISBN-10: 2940411123
ISBN-13: 978-2940411122
Product Dimensions: 16 x 1.7 x 23 cm
Continue reading »