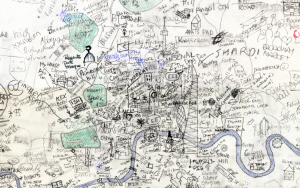
Music Mapping
The tube as a music instrument. Alexander Chen composed an interesting musical piece by using data from the tube. “Conductor turns the New York subway system into an interactive string instrument. Using the MTA’s actual subway schedule, the piece begins in realtime by spawning trains which departed in the last minute, then continues accelerating through a 24 hour loop. The visuals are based on Massimo Vignelli’s 1972 diagram.”
Mapping music
Composer Dmitri Tymoczko of Princeton University has developed a way to represent music spatially. “Using non-Euclidean geometry and a complex figure, borrowed from string theory, called an orbifold (which can have from two to an infinite number of dimensions, depending on the number of notes being played at once), Tymoczko’s system shows how chords that are generally pleasing to the ear appear in locations close to one another, clustered close to the orbifold’s center. Sounds that the ear identifies as dissonant appear as outliers, closer to the edges.”
Visualizing music
“Mam Player” turns midi files into artistic, musically related, bar-graph scores. In the World Wide Web, there are hundreds different types of music visualizations, and that is because midi (Musical Instrument Digital Interface), is basically a musical data file. “MIDI data is stored as the various trigger instructions for any given sound source” .
For more information about how this visualization was produced:
Visualization produced by Steven Malinowsky
http://www.musanim.com/ProductionNotes/ClairDeLune.html
freeware “Music Animation Machine Midi Player” for producing music visualizations:
http://www.musanim.com/player/
Continue reading »