The Evolution of London’s Streets
This animation shows how the roads in the London area f […]
Continue reading »The latest outputs from researchers, alumni and friends at the UCL Centre for Advanced Spatial Analysis (CASA).

This animation shows how the roads in the London area f […]
Continue reading »Recently I have been looking into different algorithms for the clustering geospatial data. The problem of finding “similar” regions in space, is a very interesting one, since this type of classification enables a whole range of applications (e.g.: urban development, … Continue reading →![]()
London map charts city from Roman roads to 21st century skyscrapers Daily MailThe Bartlett Centre for Advanced Spatial Analysis, London, created the video which shows the growth of the city’s road network and many listed buildings.
Continue reading »London map charts city from Roman roads to 21st century skyscrapers Daily MailThe Bartlett Centre for Advanced Spatial Analysis, London, created the video which shows the growth of the city’s road network and many listed buildings.
Continue reading »London map charts city from Roman roads to 21st century skyscrapers Daily MailThe Bartlett Centre for Advanced Spatial Analysis, London, created the video which shows the growth of the city’s road network and many listed buildings.
Continue reading »The Guardian |
The evolution of London: the city’s near-2000 year history mapped
The Guardian How did London evolve from its creation as a Roman city in 43AD to the crowded, chaotic megacity we see today? The London Evolution Animation takes a holistic view of what was built in the capital during different historical periods – what has been … |
|
The evolution of London: the city’s near-2000 year history mapped
The Guardian The visualisation, originally created for the Almost Lost exhibition by the Bartlett Centre for Advanced Spatial Analysis (Casa), explores the development of the city through the evolution of the road network and preserved buildings. Unlike other … |
TweetWe are pleased to announce that the 22nd annual PopFest conference – the population studies conference organised by postgraduates for postgraduates – will be taking place at University College London this year. PopFest2014 will be hosted by the UCL Department of Geography from Monday 4th to Wednesday the 6th of August 2014. The conference […]
Continue reading »The evolution of London: the city’s near-2,000 year history mapped The GuardianHow did London become what it is today? Researchers at the Centre for Advanced Spatial Analysis trawled huge datasets to map the transformation of the …
Continue reading »The evolution of London: the city’s near-2000 year history mapped The GuardianHow did London become what it is today? Researchers at the Centre for Advanced Spatial Analysis trawled huge datasets to map the transformation of the …
Continue reading »The evolution of London: the city’s near-2,000 year history mapped The GuardianHow did London become what it is today? Researchers at the Centre for Advanced Spatial Analysis trawled huge datasets to map the transformation of the …
Continue reading »|
UK schools use web-enabled sensors to monitor environmnet
Telecompaper (subscription) … ScienceScope and supported by the ‘Distance’ consortium, which includes Intel, Stakeholder Design, LogMeIn, Mission Explore, The University of Birmingham’s Urban Climate Laboratory, University College London’s Centre for Advanced Spatial Analysis, … |
At the beginning of April, the European Citizen Science Association (ECSA) held its first Annual General Meeting in Copenhagen. In the meeting, which lasted a long afternoon and an evening many topics were covered – from membership (it’s now possible to join) to reports from the working groups. With an aim to be transparent and […]![]()
This attractive hand-drawn map, by Adam Dant, is of the […]
Continue reading »A very special figure in the architectural history of the Netherlands has finally a architectural monograph dedicated to his work in a new international edition: Hugh Maaskant. Architect of Progres. It is not just the architect Maaskant himself, but …
Continue reading »
A very special figure in the architectural history of the Netherlands has finally a architectural monograph dedicated to his work in a new international edition: Hugh Maaskant. Architect of Progres. It is not just the architect Maaskant himself, but …
Continue reading »
A very special figure in the architectural history of the Netherlands has finally a architectural monograph dedicated to his work in a new international edition: Hugh Maaskant. Architect of Progres. It is not just the architect Maaskant himself, but …
Continue reading »
A very special figure in the architectural history of the Netherlands has finally a architectural monograph dedicated to his work in a new international edition: Hugh Maaskant. Architect of Progres. It is not just the architect Maaskant himself, but …
Continue reading »The 2000 Year Evolution Of The City Of London Scout Magazine
Continue reading »The Atlantic Cities |
Visualizing London’s Evolution From Roman Times to Today
The Atlantic Cities A new animation from University College London’s Bartlett Centre for Advanced Spatial Analysis illustrates how London has changed from Roman times to the present day. Extracting from thousands of georeferenced records, “London Evolution Animation” … |
Watch London Evolve In This AnimationLondonistThe London Evolution Animation was made by Flora Roumpani and Polly Hudson and is yet another production from the incredible (and incredibly busy) Centre for Advanced Spatial Analysis at UCL, in partnership…
Continue reading »Watch London Evolve In This Animation Londonist
Continue reading »On 29th April, I gave a talk in the Wilson Center in Washington DC on ‘Environmental Information – the Roles of Experts and the Public‘. The event was organised by Lea Shanley, who is heading the ‘Commons Lab‘ initiative of the center, and Dr Jay Benforado, from the US Environment Protection Agency (EPA) provided a […]![]()
On 29th April, I gave a talk in the Wilson Center in Washington DC on ‘Environmental Information – the Roles of Experts and the Public‘. The event was organised by Lea Shanley, who is heading the ‘Commons Lab‘ initiative of the center, and Dr Jay Benforado, from the US Environment Protection Agency (EPA) provided a […]![]()
On 29th April, I gave a talk in the Wilson Center in Washington DC on ‘Environmental Information – the Roles of Experts and the Public‘. The event was organised by Lea Shanley, who is heading the ‘Commons Lab‘ initiative of the center, and Dr Jay Benforado, from the US Environment Protection Agency (EPA) provided a […]![]()
The Roman Road network 410AC, as a floating layer over contemporary London in 3D. How did London become what it is today? How did it evolve and why? It is widely known that London is a historical city. One that has been inhabited for over 1500 yea…
Continue reading »The London Evolution Animation (LEA) was developed by The Bartlett Centre for Advanced Spatial Analysis (UCL), as a partnership project between English Heritage, The Centre for Smart Infrastructure and Construction (University of Cambridge)/Dr Kiril Stanilov and Museum of London Archaeology (MOLA) (with the Mapping London and Locating London’s Past projects), and was initiated and directed by Polly Hudson (PHD).
The exhibition is found online in Polly’s Hudson Almost Lost online and its a great showcase of London’s historic wealth. Further information on the Animation, a historical overview and on the production of the video can also be found in Polly’s Hudson website.
List of References:
A. Paolo Masucci, Kiril Stanilov and Michael Batty (2013) The growth of London’s street network in its dual representation http://www.bartlett.ucl.ac.uk/casa/publications/working-paper-189
CASA UCL: http://www.bartlett.ucl.ac.uk/casa
MOLA: http://www.museumoflondonarchaeology.org.uk/NewsProjects/Current-News/LondonEvolutionAnimation.htm
Cambridge: http://www-smartinfrastructure.eng.cam.ac.uk/
English Heritage: http://www.english-heritage.org.uk/
Continue reading »
The London Evolution Animation (LEA) was developed by The Bartlett Centre for Advanced Spatial Analysis (UCL), as a partnership project between English Heritage, The Centre for Smart Infrastructure and Construction (University of Cambridge)/Dr Kiril Stanilov and Museum of London Archaeology (MOLA) (with the Mapping London and Locating London’s Past projects), and was initiated and directed by Polly Hudson (PHD).
The exhibition is found online in Polly’s Hudson Almost Lost online and its a great showcase of London’s historic wealth. Further information on the Animation, a historical overview and on the production of the video can also be found in Polly’s Hudson website.
List of References:
A. Paolo Masucci, Kiril Stanilov and Michael Batty (2013) The growth of London’s street network in its dual representation http://www.bartlett.ucl.ac.uk/casa/publications/working-paper-189
CASA UCL: http://www.bartlett.ucl.ac.uk/casa
MOLA: http://www.museumoflondonarchaeology.org.uk/NewsProjects/Current-News/LondonEvolutionAnimation.htm
Cambridge: http://www-smartinfrastructure.eng.cam.ac.uk/
English Heritage: http://www.english-heritage.org.uk/
Continue reading »
The London Evolution Animation (LEA) was developed by The Bartlett Centre for Advanced Spatial Analysis (UCL), as a partnership project between English Heritage, The Centre for Smart Infrastructure and Construction (University of Cambridge)/Dr Kiril Stanilov and Museum of London Archaeology (MOLA) (with the Mapping London and Locating London’s Past projects), and was initiated and directed by Polly Hudson (PHD).
The exhibition is found online in Polly’s Hudson Almost Lost online and its a great showcase of London’s historic wealth. Further information on the Animation, a historical overview and on the production of the video can also be found in Polly’s Hudson website.
List of References:
A. Paolo Masucci, Kiril Stanilov and Michael Batty (2013) The growth of London’s street network in its dual representation http://www.bartlett.ucl.ac.uk/casa/publications/working-paper-189
CASA UCL: http://www.bartlett.ucl.ac.uk/casa
MOLA: http://www.museumoflondonarchaeology.org.uk/NewsProjects/Current-News/LondonEvolutionAnimation.htm
Cambridge: http://www-smartinfrastructure.eng.cam.ac.uk/
English Heritage: http://www.english-heritage.org.uk/
Continue reading »
I presented some research I’ve carried out at CASA, at the Cycle City conference in Leeds last week. The research shows how the numbers of bikeshare bikes and docking stations have varied between 2010 and 2014, for 46 systems across the world (not all systems have numbers for whole period of study). The numbers are […]
Continue reading »I presented some research I’ve carried out at CASA, at the Cycle City conference in Leeds last week. The research shows how the numbers of bikeshare bikes and docking stations have varied between 2010 and 2014, for 46 systems across the world (not all systems have numbers for whole period of study). The numbers are […]
Continue reading »
I presented some research I’ve carried out at CASA, at the Cycle City conference in Leeds last week. The research shows how the numbers of bikeshare bikes and docking stations have varied between 2010 and 2014, for 46 systems across the world (not all systems have numbers for whole period of study). The numbers are […]
Continue reading »In planning there are various Centenary events this year and next. This year the Bartlett School of Planning will celebrate its existence for 100 years along with the Royal Town Planning Institute, also founded 100 years ago in 1914. Next … Continue reading →
Continue reading »In citizen science, you always learn new things, and one of the aspects of this area that I like most is the cross-over between different areas of science. By learning about citizen science projects, you also learn about current research activities in Astronomy, Ecology, Conservation, Environmental Science and many other areas. Some occasions, however, provide an […]![]()
In citizen science, you always learn new things, and one of the aspects of this area that I like most is the cross-over between different areas of science. By learning about citizen science projects, you also learn about current research activities in Astronomy, Ecology, Conservation, Environmental Science and many other areas. Some occasions, however, provide an […]![]()
So said the English statistician George Box with his colleague Norman Draper in his 1987 book Empirical Model Building. I saw him espouse this idea at the Royal Statistical Society in a lecture in the 1980s and the quote is … Continue reading →
Continue reading »TweetThe main aim of the workshop is to bring together both academics and practitioners of probabilistic population forecasting to discuss barriers to the uses of probabilistic forecasts and possible ways to overcome them. A second aim is to learn from the best practice in other areas of application of probabilistic forecasting. The focus of the […]
Continue reading »Canalology is a short “festival of contemporary a […]
Continue reading »What does science look like? This might evoke black and white images of the cities and sixties showing male scientists in white lab coats bent over a table where some assistant has layed out various tools and models. Materials are steel, chrome, glass …
Continue reading »
What does science look like? This might evoke black and white images of the cities and sixties showing male scientists in white lab coats bent over a table where some assistant has layed out various tools and models. Materials are steel, chrome, glass and colourful plastic. Shown in the background is probably a black board with some formulas and equations written on.
But what does science really look like, today? In a new Lars Müller Publishers publication Andri Pol shows the reader some inside glimpse of one of the biggest scientific research labs in the world. In Inside CERN: European Organization for Nuclear Research he has been documenting work and live in and around CERN, the European Organisation for Nuclear Research.
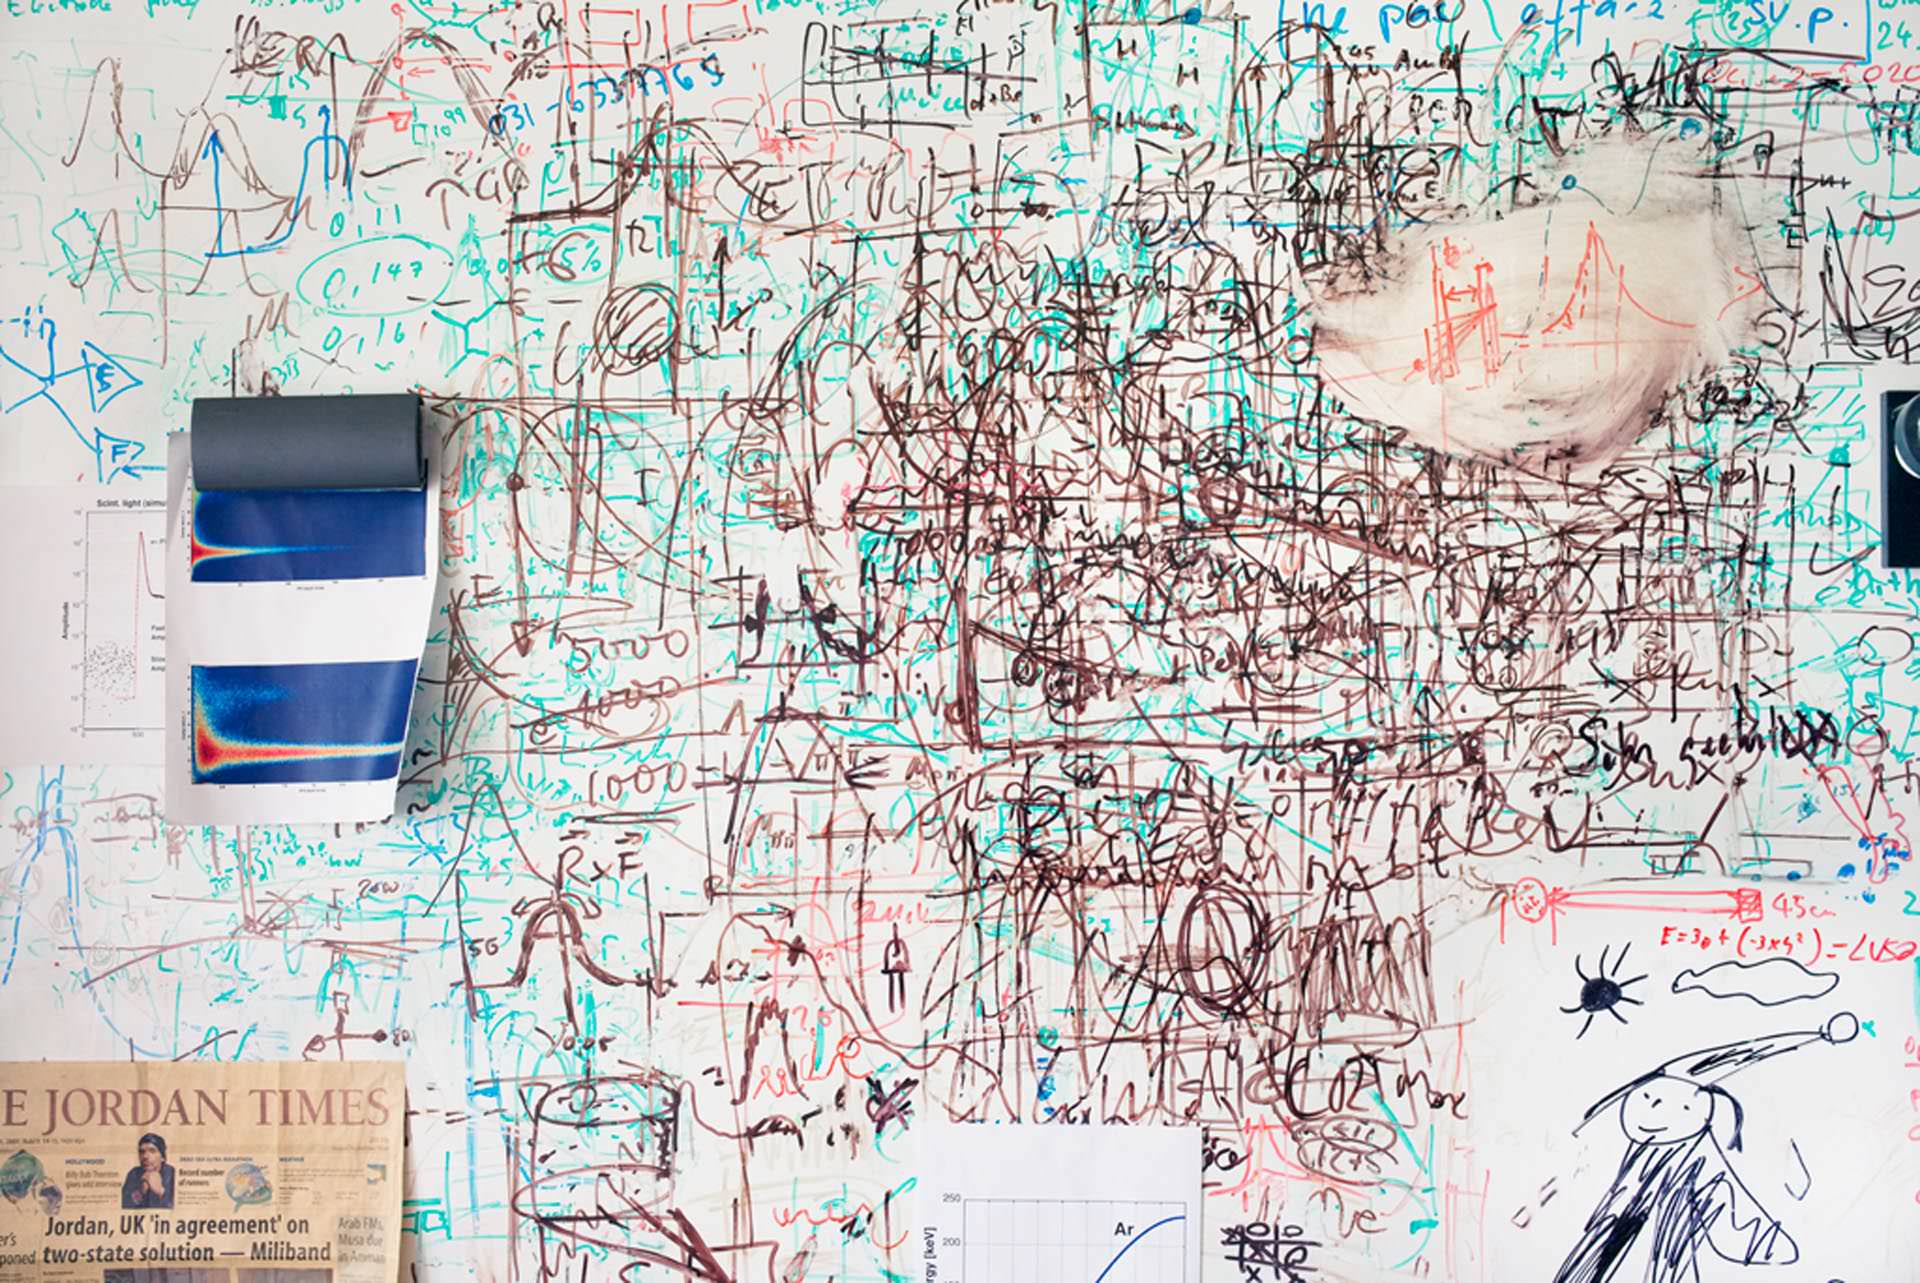
 Image taken from uncubemagazine / ‘layered equations’ p.233.
Andri Pol is a Swiss freelance photographer with a specific focus on the everyday. This is also how he portraits the places, labs, offices, scientists and atmospheres at CERN, with great curiosity and respect.
There are no pretty pictures to be found in this documentation and there are no glorious moments. Its all about the effort, the struggle and the dedication. Flipping though the pages only unveils a great range of colours and oddly chosen angles or frames. The book does not work that way. The photographs are actually rather complex compositions with a lot of depth each with not just one but often a number of aspects.
Whilst there is a lot of equipment and machines visible there is an emphasis on the people who are involved at CERN in some way. Being this the scientists, indeed sometimes in white overcoats and blue shoe protectors, technical staff or students. People from all over the world come together at CERN working in teams. This is often shown, science is discussion and exchange.
The documentation portraits also the atmosphere at CERN. Beside the highly technical installations there is very little shiny and new infrastructure. In fact most of the facilities seem to be rather pragmatic and often improvised. It is clear the focus is somewhere else. This place is not about design and style, but about customablilty, flexibility and improvisation. That does not mean that self expression is absence. On the contrary the numerous portraits of individualised desks, doors, books and computers themselves tell a story.
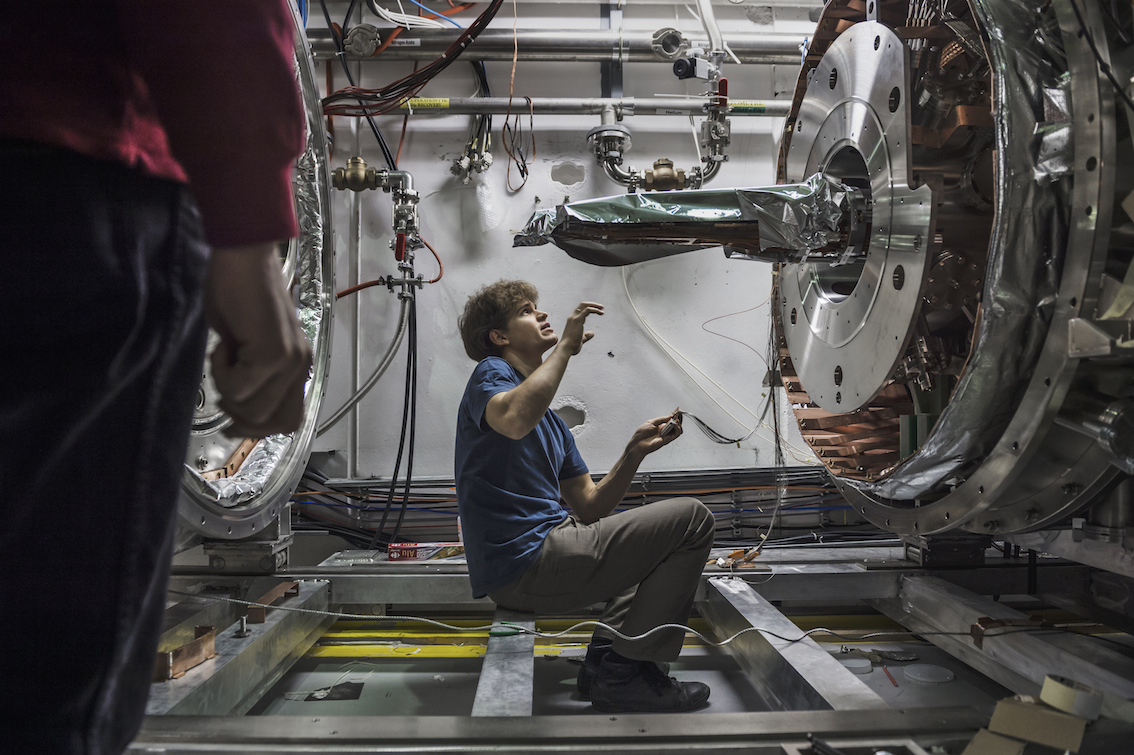
 Image taken from klatmagazine / ‘calibrate’ p.243.
Only on the last few pages the photographs stet to show some of the machinery of the actual Large Hadron Collider (LHC), photographs that look similar to what is usually circulated in the meadia. By that point the reader is already so deep immersed in the atmosphere at CERN that is seems to be most natural thing to walk past this monster of infrastructure that doesn’t even fit on a photograph. In many ways all the other photographs tell a much more telling tale of the LHC than the tons of steel, cable and concrete.
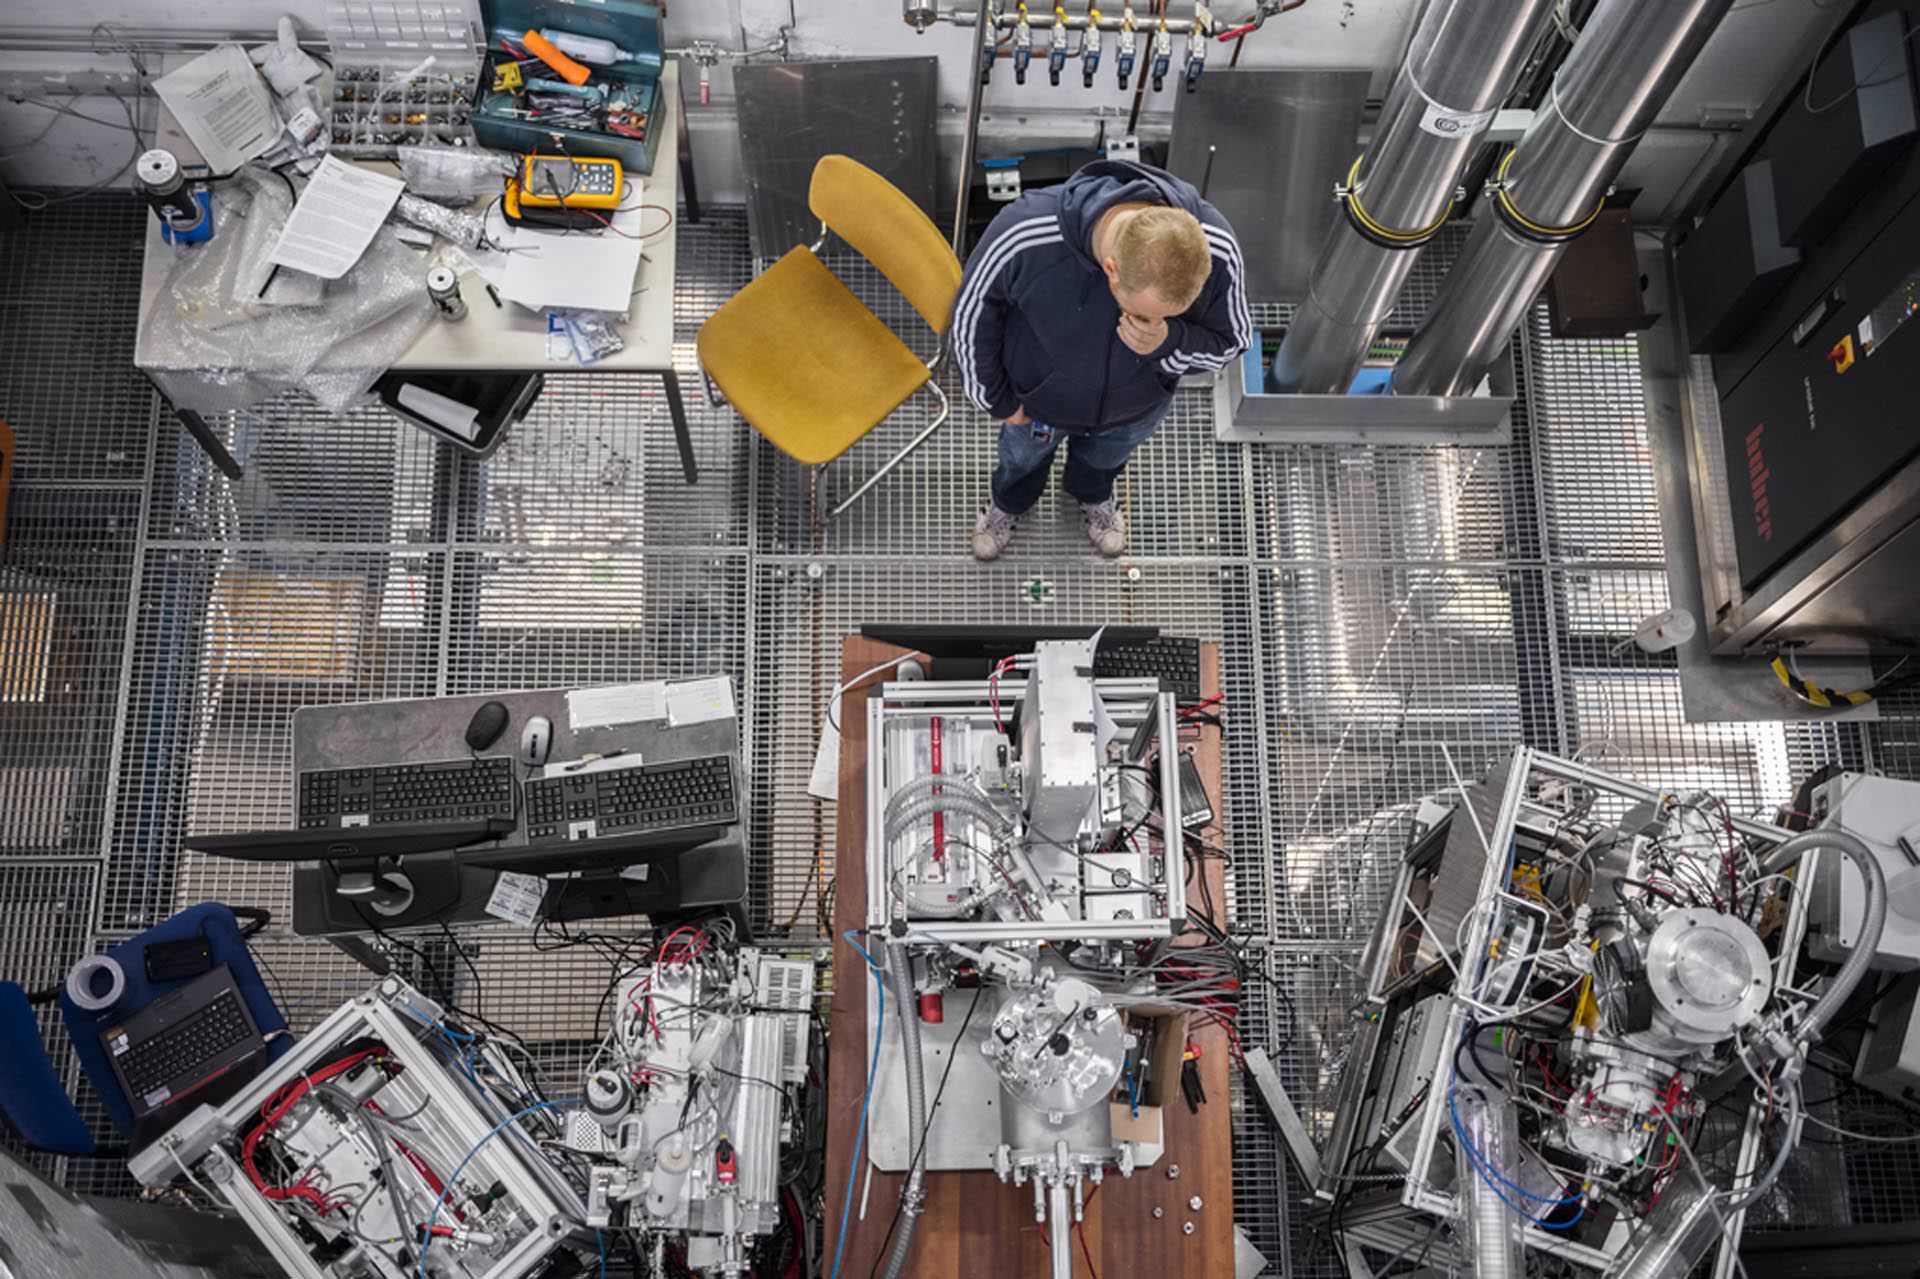
 Image taken from uncubemagazine / ‘thinking’ p.249.
This being a Lars Müller Publisher publication it does not come as a surprise that this is a very beautifully made book. A lot of care has gone into the design of the book and the selection of the photographs. Even though it is mainly a picture book a real narrative is being told here something that captivates the reader. This book certainly tells a very different story about science today. It is of course documenting science in a unique biotope of research and collaboration creating a special place between Switzerland and France. But what it shows is the fascination and dedication of the individuals working in this field and manages to transport this.
If this is not quite yet enough. Google has collaborated with cern and it features on Street View. Try this link to go on a virtual walk around CERN and the LHC.
 Image taken from amazon.com / Book cover. More details also available on the book website at insidecern.com.
Pol, A., 2011. Inside CERN: European Organization for Nuclear Research. Lars Muller Publishers, Zürich.
Continue reading »