Natural Disasters and Crowdsourcing: Haiti

Natural disasters such as earthquakes and tsunamis occur all over the world, altering the physical landscape and often severely disrupting people’s daily lives. Recently researchers’ attention has focused on using crowds of volunteers to help map the infrastructure and devastation caused by natural disasters, such as those in Haiti and Pakistan. For example, in the movie below shows the response to the earthquake by the OpenStreetMap community within 12 hours of the earthquake. The white flashes indicate edits to the map (often by tracing satellite/aerial photography).
While this data is extremely useful, as it is allows us to assess damage and thus aid the distribution of relief, but it tells us little about how the people in such areas will react to the devastation, the supply of food, or the reconstruction. To address this, we are exploring how agent-based modeling can be used to explore peoples reactions. To do this we have created a prototype spatially explicit agent-based model, created using crowdsourced geographic information and other sources of publicly available data, which can be used to study the aftermath of a catastrophic event. The specific case modeled here is the Haiti earthquake of January 2010. Crowdsourced data is used to build the initial populations of people affected by the event, to construct their environment, and to set their needs based on the damage to buildings. 

The idea behind the model is to explore how people react to the distribution of aid, as well as how rumors propagating through the population and crowding around aid distribution points might lead to food riots and similar social phenomena. Such a model could potentially provide a link between socio-cultural information of the people affected and relevant humanitarian relief organizations.

<p><p>sssss</p></p>

The animation above shows one simulation run where there is the spread of  information and agent movement (red dots) around one center (blue dot). While the chart below shows how over time the density of agents around the food station increases over time.

The idea behind such a model is one can take crowdsourced information and fuse it into an agent-based model and see how people will react to the distribution of food centers. For example, the movie below shows how agents find out about four (hypothetical) different food centers and decide whether or not to go to them in a 6 by 8km area of Port-au-Prince.

Spread of information and agent movement (red dots) in a 6 by 8km area of Port-au-Prince.
More details about this model to come……
Continue reading »

Workshop- Mapping Social Interactions Online, Oxford Internet Institute


Last Friday (9thMarch), Oxford Internet Institute (OII) opened Internet research methodology workshop- Mapping Social Interactions Online at OII seminar room. It was one of OII’s successive workshop ‘Beyond Survey’ in 2011-2012.
This workshop was mainly composed of two parts. Dr Mark Graham led one part with the topic of Mapping with GIS and Dr Sandra Gonzalez-Bailon gave a lecture of social networks. Because the most participants are doing interdisciplinary researches which have a link to internet studies and they might not know well the methodologies of the studies, two lecturers introduced fundamental information and some basic program tools for further researches.
The research interest of Dr Mark Graham could be understood as ‘Intersection between ICT (Internet Communication Technology) and Geography’. He introduced GIS to catch and visualize invisible internet flows and social networks, and explained the concept of projection, the difference between Quantitative map and Qualitative map and some kinds of GIS programmes. While some professional GIS programmes like Arc GIS need a certain period of time to learn and utilize it, online mapping sites are more accessible for researchers and easy to create a map, therefore, he showed some online GIS websites and gave a demonstration to make a mapping on Google map by BatchGeo.com.
Below lists are the programmes and the sites which he mentioned during his lecture.

Arc GIS, Quantum GIS, TileMill, Geodesix, Mango Map, Geo IQ, BatchGeo

If you would like to know more about GIS, CASA website and their blogs should be useful.
Dr Sandra Gonzalez-Bailon provided a brief lecture about the structure of social networks. She drew simple but crucial questions like ‘What makes online networks different from offline networks?’ before starting a presentation, and she tried to resolve the questions. After introducing a historical timeline of network research, the importance of different social networks within one society and its meaning were suggested. During the lecture, she emphasized the implication what lies behind networks with multiple components and innumerable relationships of networks, and how characteristics of networks can be changed by these things. Like Dr Mark Graham, she showed some software to analyse online social networks and references which contain the contents of network theory.
The lists are below:

Social network analysis : methods and applications (1994)

Networks, Crowds, and Markets: Reasoning About a Highly Connected World (2010)

Networks: An Introduction (2010)

Exploratory Social Network Analysis with Pajek (2005)

Understanding Social Networks: Theories, Concepts, and Findings (2012)

NodeXL, Pajek, igraph,


This workshop was a good opportunity to know different approaches toward a similar topic not only research methodology but also its theoretical backgrounds. The lectures were energetic and provided interactive presentations. Some participants might want to see practical research processes of OII and how these methodologies can apply to their researches such as visualizing a relationship between online social interactions and geographical location. But, the lecturers agreed visualizing the relationship, which is my best attractive point, is a perplexing process and it needs a further development.

Continue reading »

Cartographica – Mobile GIS Platform – 03

Traditionally Geographic Information System (GIS) have been exclusively run on the Windows platform. Only very few applications run on either cross platform or exclusively on the Mac. This is part two of a review and introduction to Cartographica, a Mac based GIS software. Find part one with a general introduction HERE and the working with section HERE. This third part is looking at the mobile version for your iPhone or the iPad.

The GIS software are generally quite heavy software packages and with all them functions packed in use a fair bit of processing power. A mobile client is not quite the first choice as a platform for such an app. However, the field is where you get your data from, check on changes or record problems. Having a powerful GIS bases system right there to record the information and look up details makes your life so much easier and quite a bit more fun.

With the new quite powerful handheld devices running iOS this has become a reality and both iPad and iPhone rund GIS packages. Cartographica is offering a Cartographica Mobile app, currently at version 1.1 available now from the itunes app store.

With it you can take data with you out into the field. This is as simple as dropping files into your itunes. It will natively read shape files for example. Each file can be accessed from the mobile app, including layers.

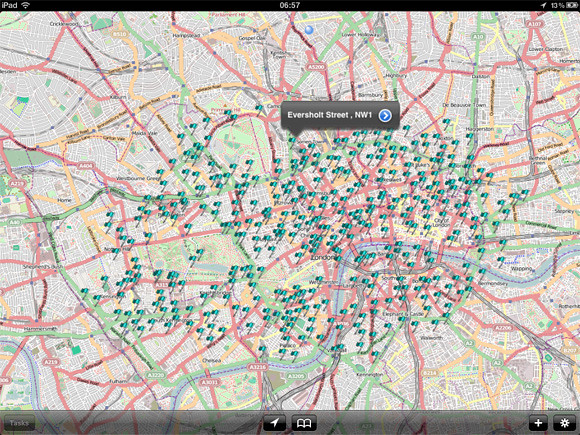
Testing this HERE is a download link for Boris Bike station locations in London from the Guardian Datastore. The data can then be droppend into itunes and opened on the iPad.
cartoBike01
Image by urbanTick / Accessing the data on your iPad. Here showing the Boris Bike station location around London. As a background OSM is used by default.

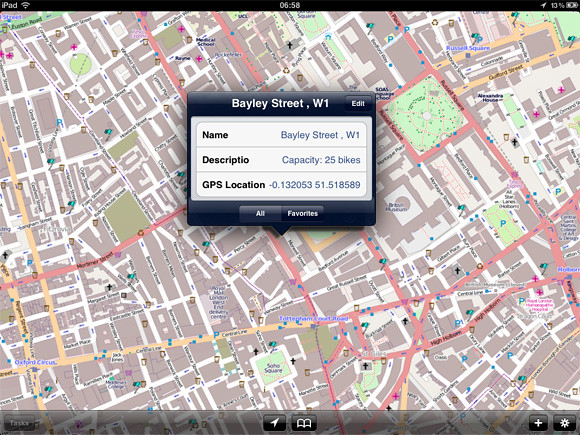
You can then zoom in and get to the details that are stored with each data point. This is flexible and can be adjusted to the need even out in the field. As done here an field for photo is added and for each location an Photograph can be recorded and linked in directly form the iPad.
cartoBike02
Image by urbanTick / Accessing the data on your iPad. Here showing the Boris Bike station location around London. The details can be accessed individually.

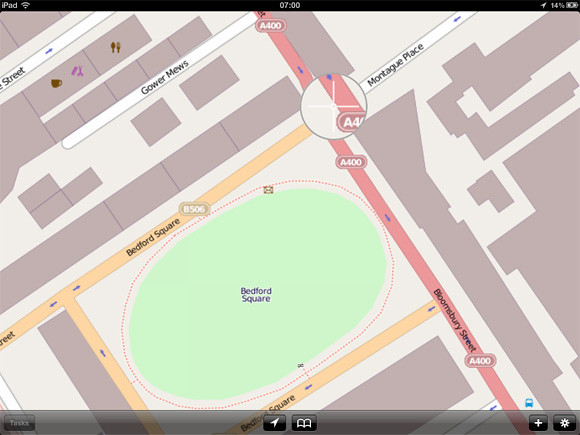
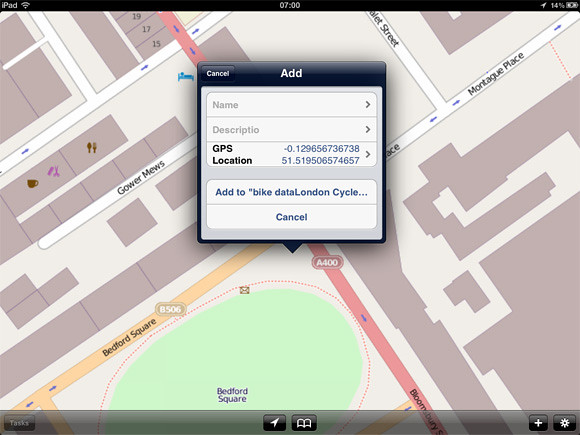
Beside looking at the data and access it new data points can be created. There is a plus button at the bottom of the screen or by keeping your finger on the screen also will bring up a zoom functions with witch a point can be manually located. Alternatively the GPS can be used to add a point at the current location.
cartoBike03
Image by urbanTick / Adding data directly on your iPad. The cross zoom helps definitely place a new data point.
cartoBike04
Image by urbanTick / Adding data directly on your iPad. The pop up dialoge lets you fill in the preset fields. Those can be manipulated on the go and new ones can be added or old ones deleted.
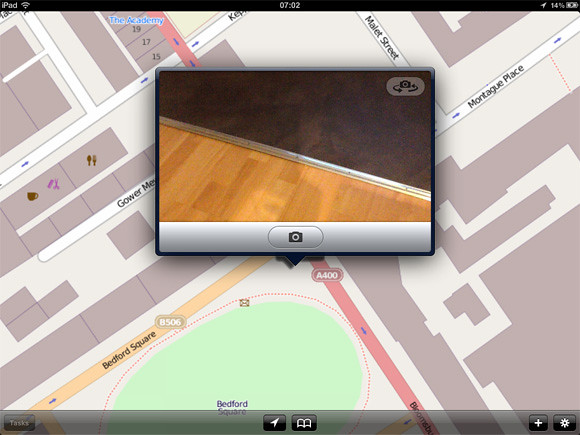
cartoBike05
Image by urbanTick / Adding data directly on your iPad. Using the iPad camera to add photographs of the location, or anything else.

What can’t be done on the go is any processing. The station platform of Cartographica offers a range of tools to analyse and visualise the data (see previous post HERE.) The mobile verson as of now does not include any of this. As such the mobile app goes as an addon rather than a replacement. It is intended to take the data with you check, extend or create and bring it back for analysis and further processing.

Nevertheless, Cartographica Mobile does integrate with a network and multiple users including live updating. This opens up possibility for collaborative work on the move and in the field. This is very need and helpful in many cases.

The Cartographica Mobile version is available from the itunes app store at a price of £54.99 or the equivalent of your currrency. It is available world wide. The Cartographica workstation software is available form the web store at a price of $495 and as an academic student license for only $99 for one year. This is tremendously good offer, especially if compared to some of the other packages prices.

Continue reading »

Cartographica – Mobile GIS Platform – 03

Traditionally Geographic Information System (GIS) have been exclusively run on the Windows platform. Only very few applications run on either cross platform or exclusively on the Mac. This is part two of a review and introduction to Cartographica, a Mac based GIS software. Find part one with a general introduction HERE and the working with section HERE. This third part is looking at the mobile version for your iPhone or the iPad.

The GIS software are generally quite heavy software packages and with all them functions packed in use a fair bit of processing power. A mobile client is not quite the first choice as a platform for such an app. However, the field is where you get your data from, check on changes or record problems. Having a powerful GIS bases system right there to record the information and look up details makes your life so much easier and quite a bit more fun.

With the new quite powerful handheld devices running iOS this has become a reality and both iPad and iPhone rund GIS packages. Cartographica is offering a Cartographica Mobile app, currently at version 1.1 available now from the itunes app store.

With it you can take data with you out into the field. This is as simple as dropping files into your itunes. It will natively read shape files for example. Each file can be accessed from the mobile app, including layers.

Testing this HERE is a download link for Boris Bike station locations in London from the Guardian Datastore. The data can then be droppend into itunes and opened on the iPad.

cartoBike01
Image by urbanTick / Accessing the data on your iPad. Here showing the Boris Bike station location around London. As a background OSM is used by default.

You can then zoom in and get to the details that are stored with each data point. This is flexible and can be adjusted to the need even out in the field. As done here an field for photo is added and for each location an Photograph can be recorded and linked in directly form the iPad.

cartoBike02
Image by urbanTick / Accessing the data on your iPad. Here showing the Boris Bike station location around London. The details can be accessed individually.

Beside looking at the data and access it new data points can be created. There is a plus button at the bottom of the screen or by keeping your finger on the screen also will bring up a zoom functions with witch a point can be manually located. Alternatively the GPS can be used to add a point at the current location.

cartoBike03
Image by urbanTick / Adding data directly on your iPad. The cross zoom helps definitely place a new data point.

cartoBike04
Image by urbanTick / Adding data directly on your iPad. The pop up dialoge lets you fill in the preset fields. Those can be manipulated on the go and new ones can be added or old ones deleted.

cartoBike05
Image by urbanTick / Adding data directly on your iPad. Using the iPad camera to add photographs of the location, or anything else.

What can’t be done on the go is any processing. The station platform of Cartographica offers a range of tools to analyse and visualise the data (see previous post HERE.) The mobile verson as of now does not include any of this. As such the mobile app goes as an addon rather than a replacement. It is intended to take the data with you check, extend or create and bring it back for analysis and further processing.

Nevertheless, Cartographica Mobile does integrate with a network and multiple users including live updating. This opens up possibility for collaborative work on the move and in the field. This is very need and helpful in many cases.

The Cartographica Mobile version is available from the itunes app store at a price of £54.99 or the equivalent of your currrency. It is available world wide. The Cartographica workstation software is available form the web store at a price of $495 and as an academic student license for only $99 for one year. This is tremendously good offer, especially if compared to some of the other packages prices.

Continue reading »

Generalising OS MasterMap Buildings

The purpose of map generalisation is to represent spatial data in a way that makes it possible to effectively view the data at scales smaller than that for which it was originally intended. In the case of the Ordnance Survey’s MasterMap product you have data at an incredibly fine level of spatial resolution, which is […]

Continue reading »

Reflections on Eye on Earth summit: the integration of GIS in Environmental Information Systems

The Eye on Earth Summit took place in Abu Dhabi on the 12 to 15 December 2011, and focused on ‘the crucial importance of environmental and societal information and networking to decision-making’. The summit was an opportunity to evaluate the development of Principle 10 from Rio declaration in 1992 as well as Chapter 40 of […]

Continue reading »

Call for Papers – Geography in Interdisciplinary Research: Threat or Opportunity?, RGS-IBG Annual International Conference 2012

Abstracts are invited for a session held by the GIScience Research Group (GIScRG) at the Royal Geographical Society – Institute of British Geographers International Conference 2012. The conference runs between 3rd – 5th July 2012. More about the session: Interdisciplinary research is not only an extremely difficult balancing act, but one which is becoming more frequent. […]

Continue reading »

Call for Papers – Modelling for Policy, RGS-IBG Annual International Conference 2012

Abstracts are invited for a session held by the GIScience Research Group (GIScRG) at the Royal Geographical Society – Institute of British Geographers International Conference 2012. The conference runs between 3rd – 5th July 2012. More about the session: This session aims to bring together researchers to report on progress in diverse types of modelling that has […]

Continue reading »

Call for Papers – Enhancing Complex Social Simulations with Automata Systems, RGS-IBG Annual International Conference 2012

Abstracts are invited for a session held by the GIScience Research Group (GIScRG) at the Royal Geographical Society – Institute of British Geographers International Conference 2012. The conference runs between 3rd – 5th July 2012. More about the session: This session aims to bring together researchers to report on progress in diverse types of automata systems […]

Continue reading »

Call for Papers – Space-time analysis, visualising everyday mobilities, and intelligent transport systems, RGS-IBG Annual International Conference 2012

Abstracts are invited for a session held jointly by the GIScience Research Group (GIScRG) and the Transport Geography Research Group (TGRG) at the Royal Geographical Society – Institute of British Geographers International Conference 2012. The conference runs between 3rd – 5th July 2012. More about the session: Geospatial technologies are an important component of transport […]

Continue reading »

Weighted Mean Direction Surfaces in Python

I work a lot with flows and spatial interactions, one thing that I’ve wanted to do for a while is compute a mean flow direction surface. Unfortunately, arithmetic means don’t work for angular data, this is because it cannot account for the circular nature of the distribution of angular measurements. For instance the angles 5 […]

Continue reading »

Observing from afar or joining the action: OSM and GIScience research

At the State of the Map (EU) 2011 conference that was held in Vienna from 15-17 July, I gave a keynote talk on the relationships between the OpenStreetMap  (OSM) community and the GIScience research community. Of course, the relationships are especially important for those researchers who are working on volunteered Geographic Information (VGI), due to […]

Continue reading »

A Spatial Approach to Location Quotients

The intent of this post is not simply to uncover where the highest density of people belonging to a particular ethnic group are, but rather to use the ‘location quotient’ (LQ) technique to compare the ethnic density in any one area to the overall ethnic density in Southwark, thus providing a relative insight into where […]

Continue reading »

Some important questions about the usability of geospatial technologies

At the beginning of May, I gave a lecture at the UCL Interaction Centre (UCLIC) seminar titled ‘Interacting with Geospatial Technologies – Overview and Research Challenges’. The talk was somewhat similar to the one that I gave at the BCS Geospatial SIG. However, I was trying to answer a question that I was asked during […]

Continue reading »
1 8 9 10 11