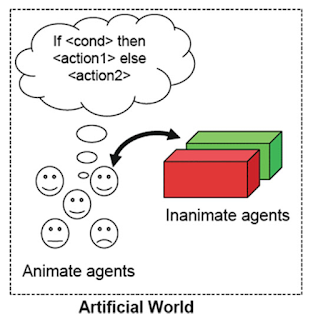
I have recently been thinking about how do people go about implementing human behavior within agent-based models. There are several good papers out their including Bill Kennedy’s (2012) paper entitled ‘
Modelling Human Behavior in Agent-Based Models‘. I thought I would attempt to sum up some of these readings in a blog post but also add to how it links to the main properties of agent-based models.
The reason I do this is that modeling human behavior is not as simple as it sounds. This is because, humans do not just make random decisions, but base their actions upon their knowledge and their abilities. Moreover, it might be nice to think that human behavior is rationale but this is not always the case, decisions can also be based on emotions (e.g. interest, happiness anger, and fear; see Izard, 2007). Moreover, emotions can influence ones decision making by altering our perceptions about the environment and future evaluations (Loewenstein and Lerner, 2003). The question therefore is how do we model human behavior? Over the last decade, one of the dominant ways of modeling human behavior in its many shapes and forms is through agent-based modeling (ABM). ABM allows us to focus on individuals or groups of individuals and give them diverse knowledge and abilities which is not possible in other modeling methodologies (see Crooks and Heppenstall, 2012). This is possible through the unique properties one can endow upon the agents (e.g. people) within such models (see Wooldridge and Jennings, 1995; Franklin and Graesser, 1996; Castle and Crooks, 2006). These properties include:
- Autonomy: In sense that we can model individual autonomous units which are not centrally governed. Through this property agents are able to process and exchange information with other agents in order to make independent decisions.
- Heterogeneity: Through using autonomous agents the notion of the average individual is redundant. Each agent can have their own properties and it’s these unique properties of individuals that cause more aggregate phenomena to develop.
- Activity: As agents are autonomous individuals with heterogeneous properties, they can exert active independent influence within a simulation. There are several ways agents can do this from being proactive (goal directed) for example trying to solve a specific problem. Or they can be reactive, in the sense agents can be designed to perceive their surroundings and given prior knowledge based on experiences (e.g. learning) or observation and take actions accordingly.
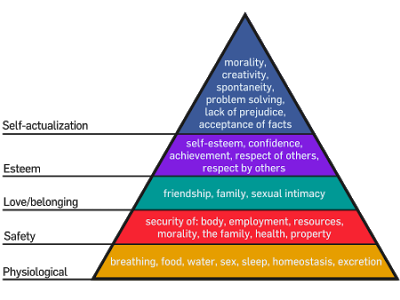
The primary strength of ABMs is as a testing ground for a variety of theoretical assumptions and concepts about human behavior (Stanilov, 2012) within the safe environment of a computer simulation. For example, we know humans process sensory information about the environment, their own current state, and their remembered history to decide what actions to take (Kennedy, 2012) all of which can be incorporated within ABMs. Through the ability to model heterogeneity within ABMs we can capture the uniqueness that makes us human, in the sense that all humans have diverse personality traits (e.g. motivation, emotion, risk avoidance) and complex psychology (Bonabeau, 2002). We also know that human behavior is influenced by others (Friedkin and Johnsen, 1999) say via their social networks which can introduce positive and negative feedbacks into the system and when people form groups, results from such groups can be greater than the sum of the group (Hong and Page, 2004). These properties again can be captured through the agent’s heterogeneity and active status. However, what drives humans? What motivates us to take certain actions? By agents being active we can test ideas and theories (e.g. Maslow’s “Hierarchy of Needs” (Maslow, 1943)) on what motivates people and why do they do certain things.
 |
| Maslow’s Hierarchy of Needs (Source: Wikipedia) |
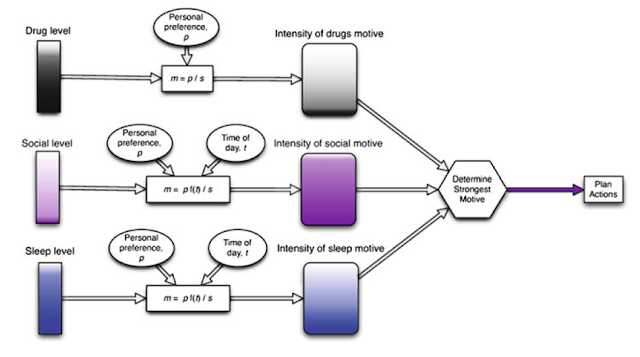
The question of how to model decision-making within an agent-based model is another important consideration. Kennedy lists three main approaches to capturing such cognitive processes within ABMs (Kennedy, 2012). The first, being a mathematical approach such as the use of ad hoc direct and custom coding of behaviors within the simulation such as using random number generators to select a predefined possible choice (e.g. to buy or sell) (Gode and Sunder, 1993). But, as noted above, people are not random which has lead researchers to develop other methods such as directly incorporating threshold-based rules, i.e. when an environment parameter passes a certain threshold a specific agent behavior will result (e.g. move to a new location when the neighborhood composition reaches a certain percentage) (Crooks, 2010). One could argue that these approaches of modeling are appropriate when behavior can be well specified. The second approach to modeling human behavior uses conceptual cognitive frameworks. Within such models, instead of using thresholds, more abstract concepts such as beliefs, desires, and intentions (BDI, (Rao and Georgeff, 1991)) or physical, emotional, cognitive, and social factors (PECS, (Schmidt, 2002)) are given to individual agents. Both the BDI and PECS frameworks have been successively applied to modeling human behavior in a number of applications such as what drives people to crime (see (Brantingham et al., 2005) and (Malleson, 2012) respectively). These conceptual cognitive frameworks and mathematical approaches for representing behavior can both be considered as rule based systems and are often applied to tens to millions of agents. The third approach, that of cognitive architectures, (e.g. Soar (Laird, 2012) and ACT-R (Anderson and Lebiere, 1998)) focus on abstract or theoretical cognition of one agent at a time with a strong emphasis on artificial intelligence compared to the other two approaches.
 |
| Determining the strongest motive before planing an action (Source: Malleson, 2012). |
ABM offers a new lens to explore human behavior allowing us to move away from more traditional methods such as rational choice theory (Coleman, 1990), where it is assumed that humans behave in ways to maximize their benefits or minimize their costs. However, people rarely meet the requirements of rational choice models (Axelrod, 1997) in the sense that most, if not all people have limited cognitive abilities and limited time to make decisions (Simon, 1996). The incorporation of this bounded rationality (e.g. limited access to information) within agent-based models addresses this issue and can be used to explore many application domains where human behavior is important.
Any thoughts or comments on what I have written here would be most appreciated.
References
- Anderson, J.R. and Lebiere, C. (1998), The Atomic Components of Thought, Mahwah, NJ.
- Axelrod, R. (1997), ‘Advancing the Art of Simulation in the Social Sciences’, in Conte, R., Hegselmann, R. and Terno, P. (eds.), Simulating Social Phenomena, Springer, Berlin, Germany, pp. 21-40.
- Bonabeau, E. (2002), ‘Agent-Based Modelling: Methods and Techniques for Simulating Human Systems’, Proceedings of the National Academy of Sciences of the United States of America, 99(3): 7280-7287.
- Brantingham, P., Glasser, U., Kinney, B., Singh, K. and Vajihollahi, M. (2005), ‘A Computational Model for Simulating Spatial Aspects of Crime in Urban Environments.’ 2005 IEEE International Conference on Systems, Man and Cybernetics (Vol. 4), pp. 3667-3674.
- Coleman, J.S. (1990), Foundations of Social Theory, Harvard University Press, Cambridge, MA.
- Crooks, A.T. (2010), ‘Constructing and Implementing an Agent-Based Model of Residential Segregation through Vector GIS’, International Journal of GIS, 24(5): 661-675.
- Friedkin, N.E. and Johnsen, E.C. (1999), ‘Social Influence Networks and Opinion Change’, Advances in Group Processes, 16(1-29).
- Gode, D.K. and Sunder, S. (1993), ‘Allocative Efficiency of Markets with Zero-Intelligence Traders: Market as a Partial Substitute for Individual Rationality’, The Journal of Political Economy, 101: 119-137.
- Hong, L. and Page, S.E. (2004), ‘Groups of Diverse Problem Solvers Can Outperform Groups of High-ability Problem Solvers’, Proceedings of the National Academic Sciences, 101(46): 16385-16389.
- Kennedy, W. (2012), ‘Modelling Human Behaviour in Agent-Based Models’, in Heppenstall, A., Crooks, A.T., See, L.M. and Batty, M. (eds.), Agent-based Models of Geographical Systems, Springer, New York, NY, pp. 167-180.
- Laird, J.E. (2012), The Soar Cognitive Architecture, The MIT Press, Cambridge, MA.
- Malleson, N. (2012), ‘Using Agent-Based Models to Simulate Crime’, in Heppenstall, A., Crooks, A.T., See, L.M. and Batty, M. (eds.), Agent-based Models of Geographical Systems, Springer, New York, NY, pp. 411-434.
- Maslow, A.H. (1943), ‘A Theory of Human Motivation’, Psychological Review, 50(4): 370-396.
- Rao, A.S. and Georgeff, M.P. (1991), ‘Modeling Rational Agents within a BDI-architecture’, in Allen, J., Fikes, R. and Sandewall, E. (eds.), Proceedings of the Second International Conference on Principles of Knowledge Representation and Reasoning, San Mateo, CA.
- Schmidt, B. (2002), ‘The Modelling of Human Behaviour: The PECS Reference Model’, Proceedings 14th European Simulation Symposium, Dresden, Germany.
- Simon, H.A. (1996), The Sciences of the Artificial (3rd Edition), MIT Press, Cambridge, M. A.
- Stanilov, K. (2012), ‘Space in Agent-Based Models’, in Heppenstall, A., Crooks, A.T., See, L.M. and Batty, M. (eds.), Agent-based Models of Geographical Systems, Springer, New York, NY, pp. 253-271.


 This month has seen the release of the 2011 census data for England and Wales at Output Area Level.


