The dramatic events involving a sinking cruise ship in the Mediterranean Sea has all of a sudden brought the topic of large cruise ships back to the front pages of News Channels from around the world. Recently only the size could possibly get the ships into the news, but a disaster is always a good selling point.
The story that unfolded over the past days however, is more than only a sunken ship, but a real crazy entangling of very unfortunate events and, as it currently seems, poor judgement of the captain. The ship passed the coast of Giglio way too close and was not at all even meant to be there, but manually steered into the disaster.
It seems almost unbelievable that a nearly 300 meter luxury cruise liner can sink just like that. Even more so as it effectively happens only 100 meter from shore. On any News coverage, alway there is the save land not just on the horizon, but right next to the ship. It is only a 100 meter or so to shore. Even so the tragic events have claimed several lives with about 19 people still being missing at the time of writing.

Image taken from DigitalGlobe-Imagery / Aerial view of the Costa Concordia sunken of the coast of Giglio. The wreck has been mapped on OSM.
Large cruise ships don’t just sink they go down with a dramatic story and this is another one of these events that bring about the mistic and special atmosphere surrounding the large passenger ships sailing the seas of the world. There are numerous stories and practices entangled in this picture of such large vessels, including the glamour and wealth on board all the way to the understood but not written down practice of ‘women and children first’ and the captain leaving the shop last. Examined in detail by the BBC.
Definitely the most famous Ocean Liner disaster is the Titanic disaster where the branded as unsinkable ship sinks after a collision with an iceberg in the North Atlantic Ocean during its maiden travel from England to America in 1912. Between then and now there are a few accidents recorded involving large cruise ships, but the industry was able to build up a very clean and save image for travels on large ocean liners.
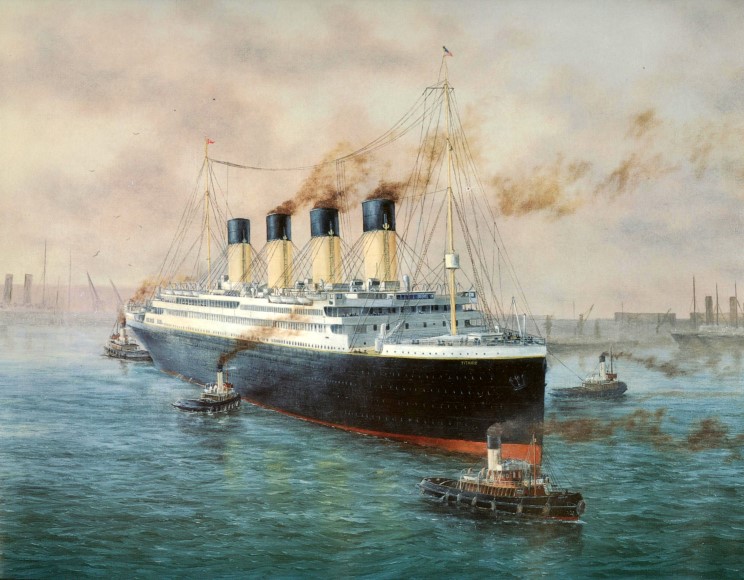
Image taken from Maritimequest / The famous Titanic.
Size matters, especially in this business. Steadily the companies are building larger units, with Oasis of the Seas currently being e largest ship being in operation. It offers space for 6296 passengers and 2165 crew. Under construction are at the moment Project Sunshine 1 and 2 expected to have a total capacity of 5700. It is size and luxury in the form of entertainment and facilities offered as selling points to attract the passengers.
Modern liners offer a lot more than only the swimming pool and the tennis court. There are water slides, wave board pools, ice rinks, rock climbing, basketball court and so on. Guest can browse through boutiques and shops, visit several restaurants and bars, entertainments show or casinos and cinemas. There is around the clock entertainment from yoga classes to guided running sessions and wine tasting on offer. Plus of course the captains dinner is still the climax of every cruise.
Cruise liner are in heir nature self contained and built to carry all necessary support systems beside the entertainment facilities. In fact these large ocean liners are more like small cities in themselves capable of catering for as many as 8000 people over periods of more than a week, with many systems being able to run for at lest a week without calling at a port.

Image taken from khulsey / A line drawing using Illustrator for the ships documentation.
The key difference between the types of ships is between cruise ships an ocean liners. As the name indicates the two categories serve very different purpose. The liner is built for a linear connection ferrying passengers between ports traditionally between the old and new world from Plymouth to New York. Cruisers on the other hand traditionally have circular routs manly for pleasure travels returning to the port of departure. There are also technical differences setting the two categories apart. Liners are built for rougher seas running deeper making smaller ports inaccessible. Cruisers are built with more passenger space, focused entertainment and specially designed for higher numbers of outside cabines and fewer inside cabins.
By now however, the only dedicated ocean liner really is the prestigious Queen Marry 2. Since 2010 is she the last remaining ocean liner representative running between Southamton and New York. However even QM2 is equipped with specialised entertainment, and runs on cruise tours every now and then.

Image taken from iglucruise / The Queen Mary 2 upon leavning New York.
Cruise liners carry a special aura with them and were especially popular in the first half of the 20 century with especially the modernist movement. Famously the architect Le Corbusier stylised the ocean liner to become the ultimate triumph of technology and symbolised the ideal city as a self contained organism. Especially in his book ‘Toward an Architecture‘ (). It’s also the aspect of mobility / traveling that implies the freedom connected to the cruise tours. An perception of independence and sovereignty is what attracted and still continues to do so.
There are a number of famous floating city project dreamed of by architects since the modernist movement. The Triton City by Buckminster Fuller or the freedomship project. But of course cruise ships have also entered the virtual world and SS Galaxy is one of the really bog projects in Second Live with a handfull of people full-time playing the crew on a virtual deck.c

Image by Wayne Mazzotta taken from maritimematters / Red Dashboard: ’59 Cadillac and SS Conte Grande.
Technology is still today a major aspect of cruise line travels from the ship design, the build, the infrastructure and the built in technology. Machines are very powerful but at the same time capable of very fine manoeuvring amid, buy the size of the latest ships dwarf ports. Navigation is built on the latest technology covered by several backup and parallel systems. Even though the atmosphere is relaxed and definitely majestic, the equipment is built on very high safety standards, covering a whole range of applications and devices. The bridge of a cruise liner is a high technology command centre covering the complexity of the entire ship.
Besides all these aspects however, the spirit of innovation and conquering of nature using technological power has faded. For cruise ships are marketed not any longer to experience the power and genius of man, but to celebrate one self. Where in the days of the ocean liner passengers would be amazed by the sheer idea of traveling on such a ship across the Atlantic, admiring its power, today guests are demanding services and entertainment. The challenges for the ship and the crew is no longer the sea, but the parties on board, it’s a matter of keeping alive a sensation.Unfortunately the tragical Accident involving the Costa Concordia and claiming several lives is most likely owed to such a

Image by Uaohk taken from maritimematters GNU Free Documentation License / The Costa Concordia as it lays on one side. COSTA CONCORDIA wreck off Isola del Giglio.
The floating city has become an fantasy entertainment park and is no longer pushing the boundaries of innovation nor is it representing progress. It has become the opposite and pretty surely the modernists would no longer see the floating amusement parks with “balcony-laden floating condominiums”, as they are described in a Wikipedia article as a representation of their fascination.
Continue reading »