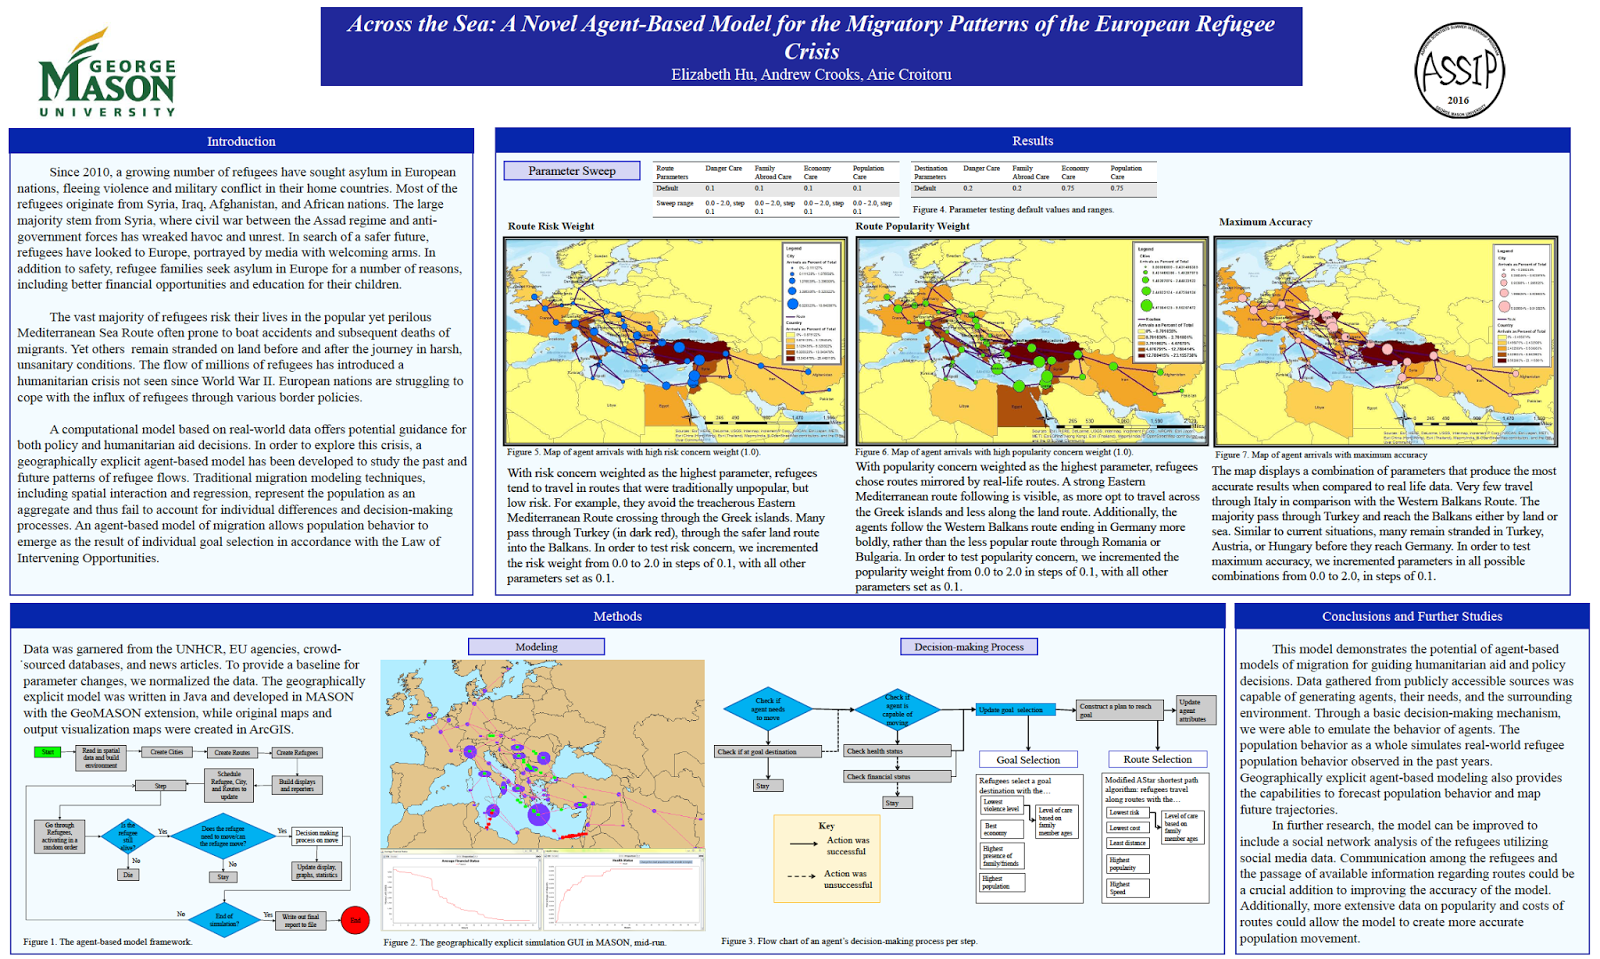
Readers of the blog might be interested in a workshop being organized by Daniel Brown, Eun-Kyeong Kim, Liliana Perez, and Raja Sengupta entitled:
Rethinking the ABCs: Agent-Based Models and Complexity Science in the age of Big Data, CyberGIS, and Sensor networks
September 27th, 2016 in Montreal, Canada
To quote from the call:
“A broad scope of concepts and methodologies from complexity science – including Agent-Based Models, Cellular Automata, network theory, chaos theory, and scaling relations – has contributed to a better understanding of spatial/temporal dynamics of complex geographic patterns and process.
Recent advances in computational technologies such as Big Data, Cloud Computing and CyberGIS platforms, and Sensor Networks (i.e. the Internet of Things) provides both new opportunities and raises new challenges for ABM and complexity theory research within GIScience. Challenges include parameterization of complex models with volumes of georeferenced data being generated, scale model applications to realistic simulations over broader geographic extents, explore the challenges in their deployment across large networks to take advantage of increased computational power, and validate their output using real-time data, as well as measure the impact of the simulation on knowledge, information and decision-making both locally and globally via the world wide web.
The scope of this workshop is to explore novel complexity science approaches to dynamic geographic phenomena and their applications, addressing challenges and enriching research methodologies in geography in a Big Data Era.”
More information about the workshop can be found at https://sites.psu.edu/bigcomplexitygisci/
Continue reading »