As you might of guessed the paper is about riots but that is not all. In the paper we have a highly detailed cognitive model implemented through the
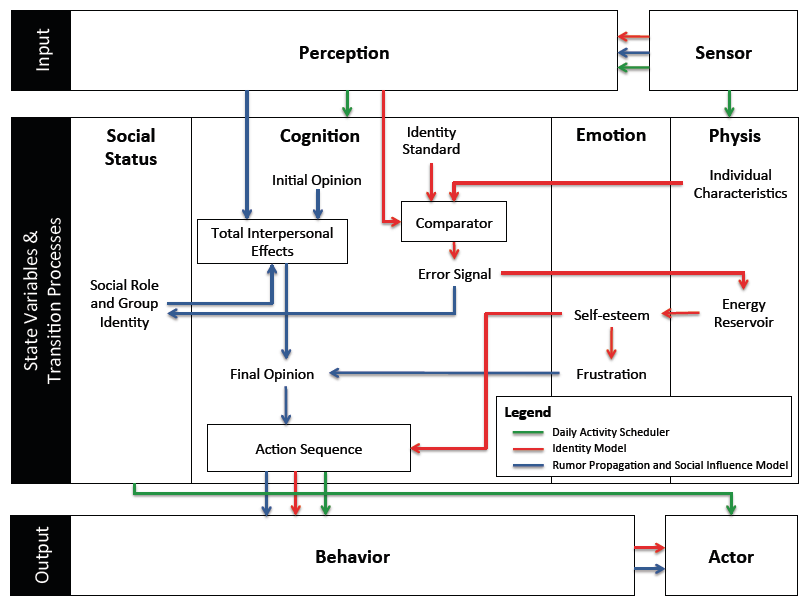
PECS (Physical conditions, Emotional state, Cognitive capabilities, and Social status) framework based around identity theory. The purpose of the model (and paper) is to explore how the unique socioeconomic variables underlying
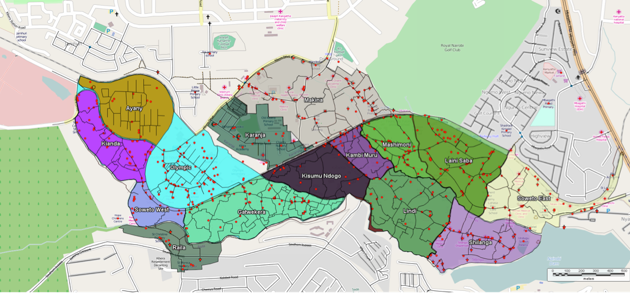
Kibera, a slum in Nairobi, coupled with local interactions of its residents, and the spread of a rumor, may trigger a riot such as those seen in 2007.
In order to explore this question from the “bottom up” we have developed a novel agent-based model that integrates social network analysis (SNA) and geographic information systems (GIS) for this purpose. In the paper we argue that this integration facilitates the modeling of dynamic social networks created through the agents’ daily interactions. The GIS is used to develop a realistic environment for agents to move and interact that includes a road network and points of interest which impact their daily lives.
Below is the abstract and a summary of its highlights in order to give you a sense of what our research contribution is. In addition to this we also provide some images either from the paper itself or the from Overview, Design Concepts, and Details (ODD) protocol. Finally at the bottom of this post you can see one of the simulation runs, details of where the model can be downloaded along with the full citation.
Paper Abstract:
Immediately after the 2007 Kenyan election results were announced, the country erupted in protest. Riots were particularly severe in Kibera, an informal settlement located within the nations capital, Nairobi. Through the lens of geosimulation, an agent-based model is integrated with social network analysis and geographic information systems to explore how the environment and local interactions underlying Kibera, combined with an external trigger, such as a rumor, led to the emergence of riots. We ground our model on empirical data of Kibera’s geospatial landscape, heterogeneous population, and daily activities of its residents. In order to effectively construct a model of riots, however, we must have an understanding of human behavior, especially that related to an individual’s need for identity and the role rumors play on a person’s decision to riot. This provided the foundation to develop the agents’ cognitive model, which created a feedback system between the agents’ activities in physical space and interactions in social space. Results showed that youth are more susceptible to rioting. Systematically increasing education and employment opportunities, however, did not have simple linear effects on rioting, or even on quality of life with respect to income and activities. The situation is more complex. By linking agent-based modeling, social network analysis, and geographic information systems we were able to develop a cognitive framework for the agents, better represent human behavior by modeling the interactions that occur over both physical and social space, and capture the nonlinear, reinforcing nature of the emergence and dissolution of riots.
Keywords: agent-based modeling; geographic information systems; social network analysis; riots; social influence; rumor propagation.
Paper Highlights:
- An agent-based model integrates geographic information systems and social network analysis to model the emergence of riots.
- The physical environment and agent attributes are developed using empirical data, including GIS and socioeconomic data.
- The agent’s cognitive framework allowed for modeling their activities in physical space and interactions in social space.
- Through the integration of the three techniques, we were able to capture the complex, nonlinear nature of riots.
- Results show that youth are most vulnerable, and, increasing education and employment has nonlinear affects on rioting.
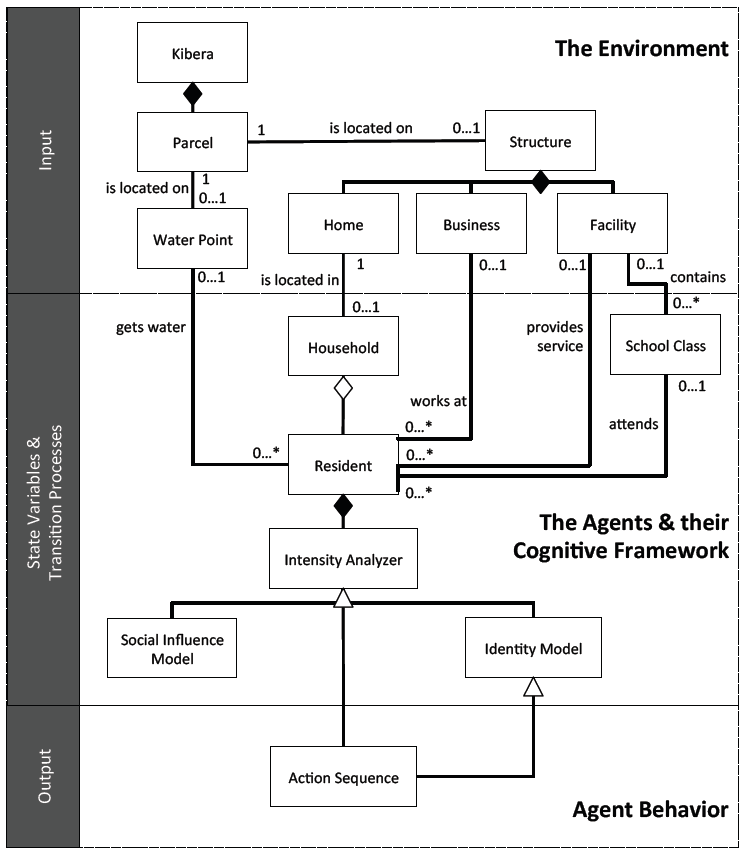
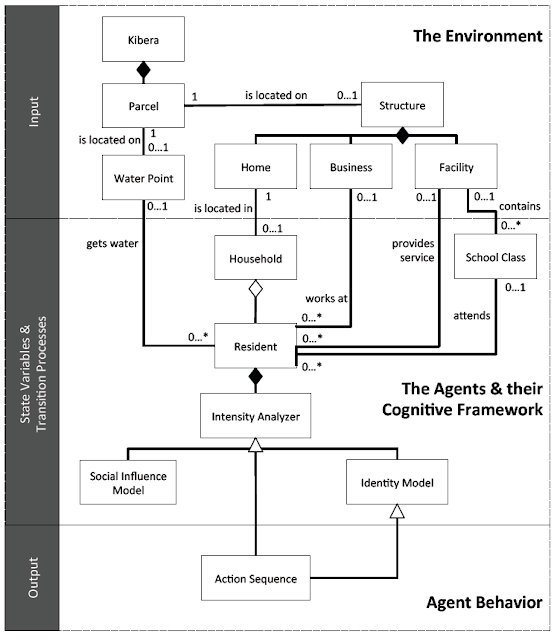 |
| The high-level UML diagram of the model |
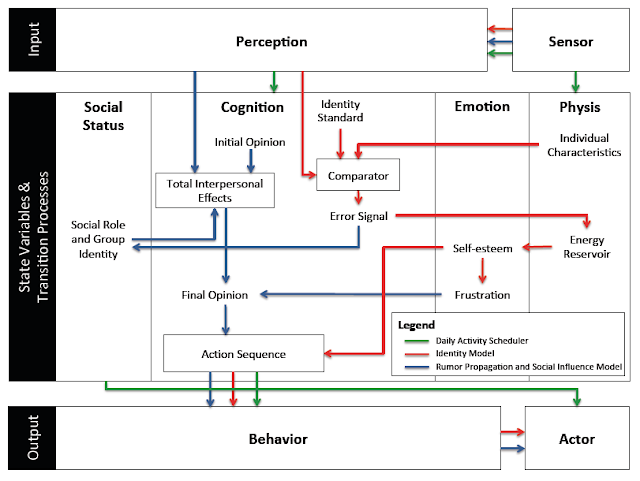 |
| A high-level representation of the model’s agent behavior incorporated into the PECS framework |
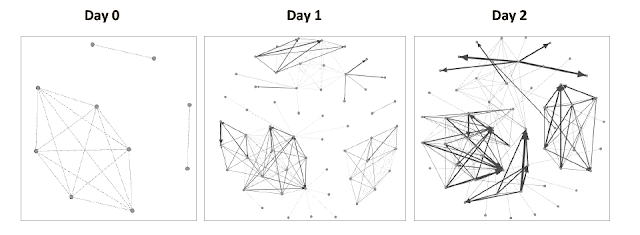 |
| An example of the evolution of social networks of ten Residents across the first two days of a simulation run. |
The movie below shows the agent-based model which explores ethnic clashes in the Kenyan slum. The environment is made up of households, businesses, and service facilities (such data comes from
OpenStreetMap). Agents within the model use a transportation network to move across the environment. As agents go about their daily activities, they interact with other agents – building out an evolving social network. Agents seek to meet their identity standard. Failure to reach their identity standard increases the agents frustration which can lead to an aggressive response (i.e. moving from blue to red color) such as rioting.
As with many of our models, we provide the data, model code and detailed model description in the form of the ODD protocol for others to use, learn more or to extend. Click here for more information.
Full Reference:
Pires, B. and Crooks, A.T. (2017), Modeling the Emergence of Riots: A Geosimulation Approach, Computers, Environment and Urban Systems, 61: 66-80. (pdf)
As normal, any thoughts or comments are most appreciated.
Continue reading »