Geography a Thriving or Declining Discipline
AAG Presentation – New York.
Continue reading »The latest outputs from researchers, alumni and friends at the UCL Centre for Advanced Spatial Analysis (CASA).

AAG Presentation – New York.
Continue reading »As part of the MRes in Advanced Spatial Analysis and Visualisation, here in CASA, we are exploring various concepts relating to urban visualisation. These include both traditional urban based modelling approaches and more abstract visualisations and si…
Continue reading »As part of the MRes in Advanced Spatial Analysis and Visualisation, here in CASA, we are exploring various concepts relating to urban visualisation. These include both traditional urban based modelling approaches and more abstract visualisations and si…
Continue reading »The Mapping London blog is 1 year today! We launched on […]
Continue reading »I presented at the CASA Seminar Series yesterday on the topic of business centre specialisation…
Continue reading »A few of my academic followers on Twitter (@frogo if your thinking of following me) asked recently what software I used on my Mac. As recent converts from Windows they want to get going and start using there shiny new fruit based computer and so this post is for them. It lists, in no particular order […]
Continue reading »Rank Clocks are a type of visualisation invented by Prof Michael Batty here at UCL CASA. They are time-based line charts, wrapped around a clockface – with the start date at the top, wrapping around clockwise to the end date. … Continue reading →
Continue reading »This week a word puzzle: Which plural noun in the English language becomes singular when you add an s? As ever, please feel free to gloat in the comments section below…..
Continue reading »From here you can download the lecture notes from my latest LTCC course: Complex Systems Dynamics. Week 1: Powerpoint slides: Part I, Part II Written notes: Part I, Part II…
Continue reading »Traditionally Geographic Information System (GIS) have been exclusively run on the Windows platform. Only very few applications run on either cross platform or exclusively on the Mac. This is part two of a review and introduction to Cartographica, a Mac based GIS software. Find part one with a general introduction HERE and the working with section HERE. This third part is looking at the mobile version for your iPhone or the iPad.
The GIS software are generally quite heavy software packages and with all them functions packed in use a fair bit of processing power. A mobile client is not quite the first choice as a platform for such an app. However, the field is where you get your data from, check on changes or record problems. Having a powerful GIS bases system right there to record the information and look up details makes your life so much easier and quite a bit more fun.
With the new quite powerful handheld devices running iOS this has become a reality and both iPad and iPhone rund GIS packages. Cartographica is offering a Cartographica Mobile app, currently at version 1.1 available now from the itunes app store.
With it you can take data with you out into the field. This is as simple as dropping files into your itunes. It will natively read shape files for example. Each file can be accessed from the mobile app, including layers.
Testing this HERE is a download link for Boris Bike station locations in London from the Guardian Datastore. The data can then be droppend into itunes and opened on the iPad.
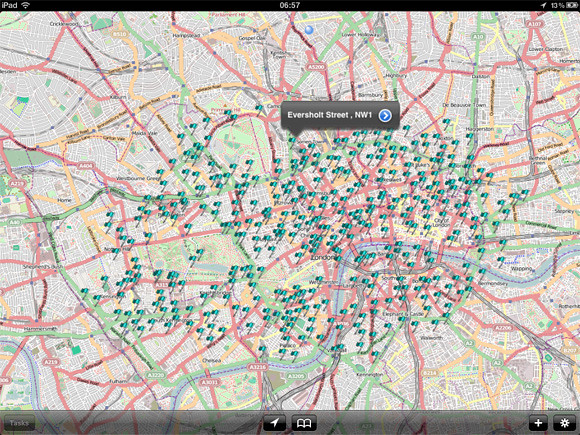
Image by urbanTick / Accessing the data on your iPad. Here showing the Boris Bike station location around London. As a background OSM is used by default.
You can then zoom in and get to the details that are stored with each data point. This is flexible and can be adjusted to the need even out in the field. As done here an field for photo is added and for each location an Photograph can be recorded and linked in directly form the iPad.
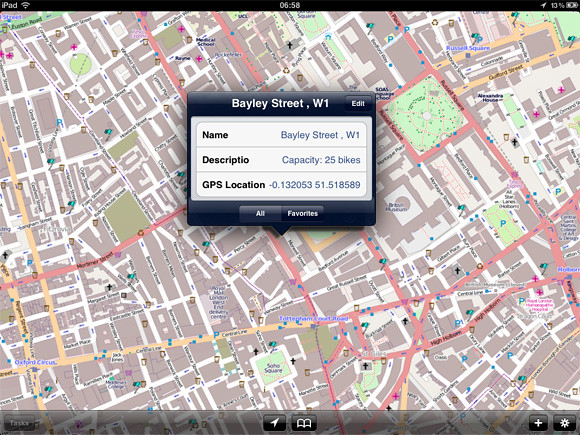
Image by urbanTick / Accessing the data on your iPad. Here showing the Boris Bike station location around London. The details can be accessed individually.
Beside looking at the data and access it new data points can be created. There is a plus button at the bottom of the screen or by keeping your finger on the screen also will bring up a zoom functions with witch a point can be manually located. Alternatively the GPS can be used to add a point at the current location.
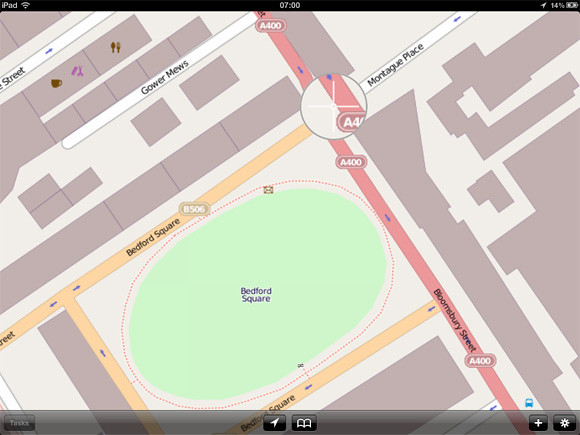
Image by urbanTick / Adding data directly on your iPad. The cross zoom helps definitely place a new data point.
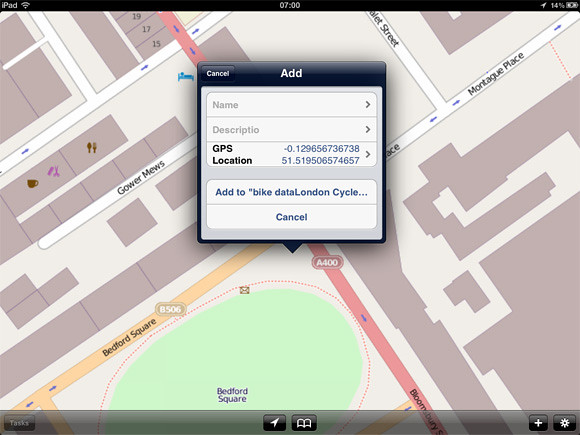
Image by urbanTick / Adding data directly on your iPad. The pop up dialoge lets you fill in the preset fields. Those can be manipulated on the go and new ones can be added or old ones deleted.
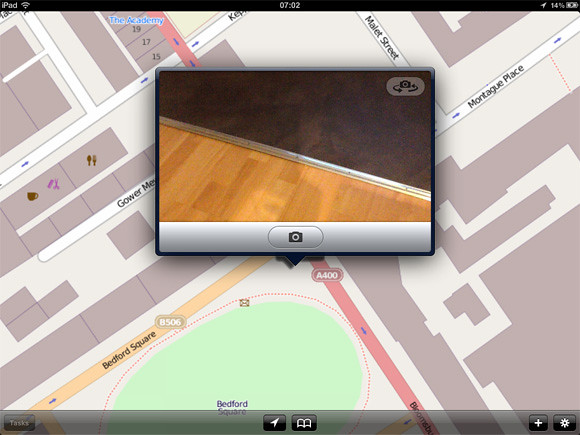
Image by urbanTick / Adding data directly on your iPad. Using the iPad camera to add photographs of the location, or anything else.
What can’t be done on the go is any processing. The station platform of Cartographica offers a range of tools to analyse and visualise the data (see previous post HERE.) The mobile verson as of now does not include any of this. As such the mobile app goes as an addon rather than a replacement. It is intended to take the data with you check, extend or create and bring it back for analysis and further processing.
Nevertheless, Cartographica Mobile does integrate with a network and multiple users including live updating. This opens up possibility for collaborative work on the move and in the field. This is very need and helpful in many cases.
The Cartographica Mobile version is available from the itunes app store at a price of £54.99 or the equivalent of your currrency. It is available world wide. The Cartographica workstation software is available form the web store at a price of $495 and as an academic student license for only $99 for one year. This is tremendously good offer, especially if compared to some of the other packages prices.
Continue reading »Traditionally Geographic Information System (GIS) have been exclusively run on the Windows platform. Only very few applications run on either cross platform or exclusively on the Mac. This is part two of a review and introduction to Cartographica, a Mac based GIS software. Find part one with a general introduction HERE and the working with section HERE. This third part is looking at the mobile version for your iPhone or the iPad.
The GIS software are generally quite heavy software packages and with all them functions packed in use a fair bit of processing power. A mobile client is not quite the first choice as a platform for such an app. However, the field is where you get your data from, check on changes or record problems. Having a powerful GIS bases system right there to record the information and look up details makes your life so much easier and quite a bit more fun.
With the new quite powerful handheld devices running iOS this has become a reality and both iPad and iPhone rund GIS packages. Cartographica is offering a Cartographica Mobile app, currently at version 1.1 available now from the itunes app store.
With it you can take data with you out into the field. This is as simple as dropping files into your itunes. It will natively read shape files for example. Each file can be accessed from the mobile app, including layers.
Testing this HERE is a download link for Boris Bike station locations in London from the Guardian Datastore. The data can then be droppend into itunes and opened on the iPad.
Image by urbanTick / Accessing the data on your iPad. Here showing the Boris Bike station location around London. As a background OSM is used by default.
You can then zoom in and get to the details that are stored with each data point. This is flexible and can be adjusted to the need even out in the field. As done here an field for photo is added and for each location an Photograph can be recorded and linked in directly form the iPad.
Image by urbanTick / Accessing the data on your iPad. Here showing the Boris Bike station location around London. The details can be accessed individually.
Beside looking at the data and access it new data points can be created. There is a plus button at the bottom of the screen or by keeping your finger on the screen also will bring up a zoom functions with witch a point can be manually located. Alternatively the GPS can be used to add a point at the current location.
Image by urbanTick / Adding data directly on your iPad. The cross zoom helps definitely place a new data point.
Image by urbanTick / Adding data directly on your iPad. The pop up dialoge lets you fill in the preset fields. Those can be manipulated on the go and new ones can be added or old ones deleted.
Image by urbanTick / Adding data directly on your iPad. Using the iPad camera to add photographs of the location, or anything else.
What can’t be done on the go is any processing. The station platform of Cartographica offers a range of tools to analyse and visualise the data (see previous post HERE.) The mobile verson as of now does not include any of this. As such the mobile app goes as an addon rather than a replacement. It is intended to take the data with you check, extend or create and bring it back for analysis and further processing.
Nevertheless, Cartographica Mobile does integrate with a network and multiple users including live updating. This opens up possibility for collaborative work on the move and in the field. This is very need and helpful in many cases.
The Cartographica Mobile version is available from the itunes app store at a price of £54.99 or the equivalent of your currrency. It is available world wide. The Cartographica workstation software is available form the web store at a price of $495 and as an academic student license for only $99 for one year. This is tremendously good offer, especially if compared to some of the other packages prices.
It is four years today since MapTube was launched at the Barbican and to mark this event, I’ve made some changes to how the home page displays. This is a bit of an experiment, but I’ve tried to make the home page display topical data by using RSS feeds from the BBC News page, the … Read more →
Continue reading »

Find out more see: @maksim2042, @JackieKazil & @ElectionGauge or at Tech Cocktail
Continue reading »Find out more see: @maksim2042, @JackieKazil & @ElectionGauge or at Tech Cocktail
Continue reading » At the upcoming AAG conference in New York, I’ll be presenting a recent prototype that links agent-based simulation with current traffic flow models.
The basic premise is that any cognitive decision associated with movement around cities should be mo…
A joint project has been set up between ONS and University College London to develop a new UK Output Area Classification, for which we are seeking your views and thoughts. The new Output Area Classification is planned to be created using 2011 Census data, when available, and is relevant to anyone interested in social area […]
Continue reading »A joint project has been set up between ONS and University College London to develop a new UK Output Area Classification, for which we are seeking your views and thoughts. The new Output Area Classification is planned to be created using 2011 Census data, when available, and is relevant to anyone interested in social area […]
Continue reading »A joint project has been set up between ONS and University College London to develop a new UK Output Area Classification, for which we are seeking your views and thoughts. The new Output Area Classification is planned to be created using 2011 Census …
Continue reading »
Athene Donald posted recently on imposter syndrome, that feeling that we’re doing something way beyond our capabilities, perhaps due to clerical error or overenthusiastic “brand management”*. As I’ve touched on before, working in an interdisciplinary team exacerbates that. I’ve heard … Continue reading →![]()
The purpose of my previous post on the TransXChange timetable data was to make it possible to track National Rail trains in real time. Due to the large number of stations making up the network and the fact that you can’t obtain information for a whole line in one go, the only viable option is … Read more →
Continue reading »This week’s teaser is about the London tube network: Which is the only London Underground station whose name does not include any of the letters in the word ‘Mackerel’? With…
Continue reading »Here is a new book on complexity and cities entitled “Complexity Theories of Cities Have Come of Age: An Overview with Implications to Urban Planning and Design” edited by Juval Portugali, Han Meyer, Egbert Stolk and Ekim Tan with the …
Continue reading »A new book on complexity and cities edited by Juval Portugali, Han Meyer, Egbert Stolk and Ekim Tan with the intriguing title that what we do has come of age. Well maybe, maybe not, I leave you to be the … Continue reading →
Continue reading »Carrying on form our previous post – Origins vs. Destinations
visualises data drawn from a random sample of New York City Yellow Cab GPS data collected in 2010:
Programmed by Juan Francisco Saldarriaga, Spatial Information Design Lab, Graduate…
Continue reading »Carrying on form our previous post – Origins vs. Destinations
visualises data drawn from a random sample of New York City Yellow Cab GPS data collected in 2010:
Programmed by Juan Francisco Saldarriaga, Spatial Information Design Lab, Graduate…
Continue reading »“Geodemographics of Housing in Great Britain R […]
Continue reading »Science Sociologist/Policy Academic/Blogger Alice Bell has very kindly invited me to take part in the Sounds of Science event on February 29th at Charles Darwin House – featuring participants from the BBC, Audioboo and the BMJ. To celebrate world radio day, … Continue reading →![]()
The Cold War years are usually presented in terms of the military force and an ever expanding resource of military equipment. This of course includes foremost the nuclear weapons both sides the West lead by the U.S. and the NATO and the Communist East lead by Russia.
Architecture however, played an important role in cicvil defence and the preparation for a potential third world war. There was far less attention payed to the fact that all nations had programs running to prepare their societies for the case of escalation. Tensions there were enough.
Nuclear war was the ultimate danger and with images and evidence form Hiroshima and Nagasaki preparation was part of civil defence programs also in the U.S. In a new book Fallout Shelter: Designing for Civil Defence in the Cold War published by University of Minnesota Press, David Monteyne presents these U.S. programs from an architectural perspective. This detailed investigation ranges from the propaganda to built examples and examines closely the role of the architect as the middle man between government and civil society implementing a plan that is further reaching than simply the provision of shelter. Find Fallout Shelter: Designing for Civil Defence in the Cold War for great prices with these Amazon Promo Codes.

Image taken from etsy / DIY fallout shelter for your back garden.
As Monteyne points out in his introduction it effectively is a contract between citizens and government exchanging provision for shelter and quality of live for cooperative behaviour. He refers to Foucaults biopower as a political relationship. Essentially building shelters was and in some cases still is, as we’ll discuss further on, the physical implementation of goals and powers of the welfare state.
The book explores in seven chapters the background, the planning, the implementation and the potential influence of shelter provision programs in the U.S. The programs were mostly about information and education but of course also aiming to build shelter provision. For this the architects were a key alley and the American Institute of Architects (AIA) launched a series of design competitions together with the Office for Civil Defense (OCD). The aim was to promote good planning and preparation for shelter provision. A series of designs were presented as winners, both built and as projects.
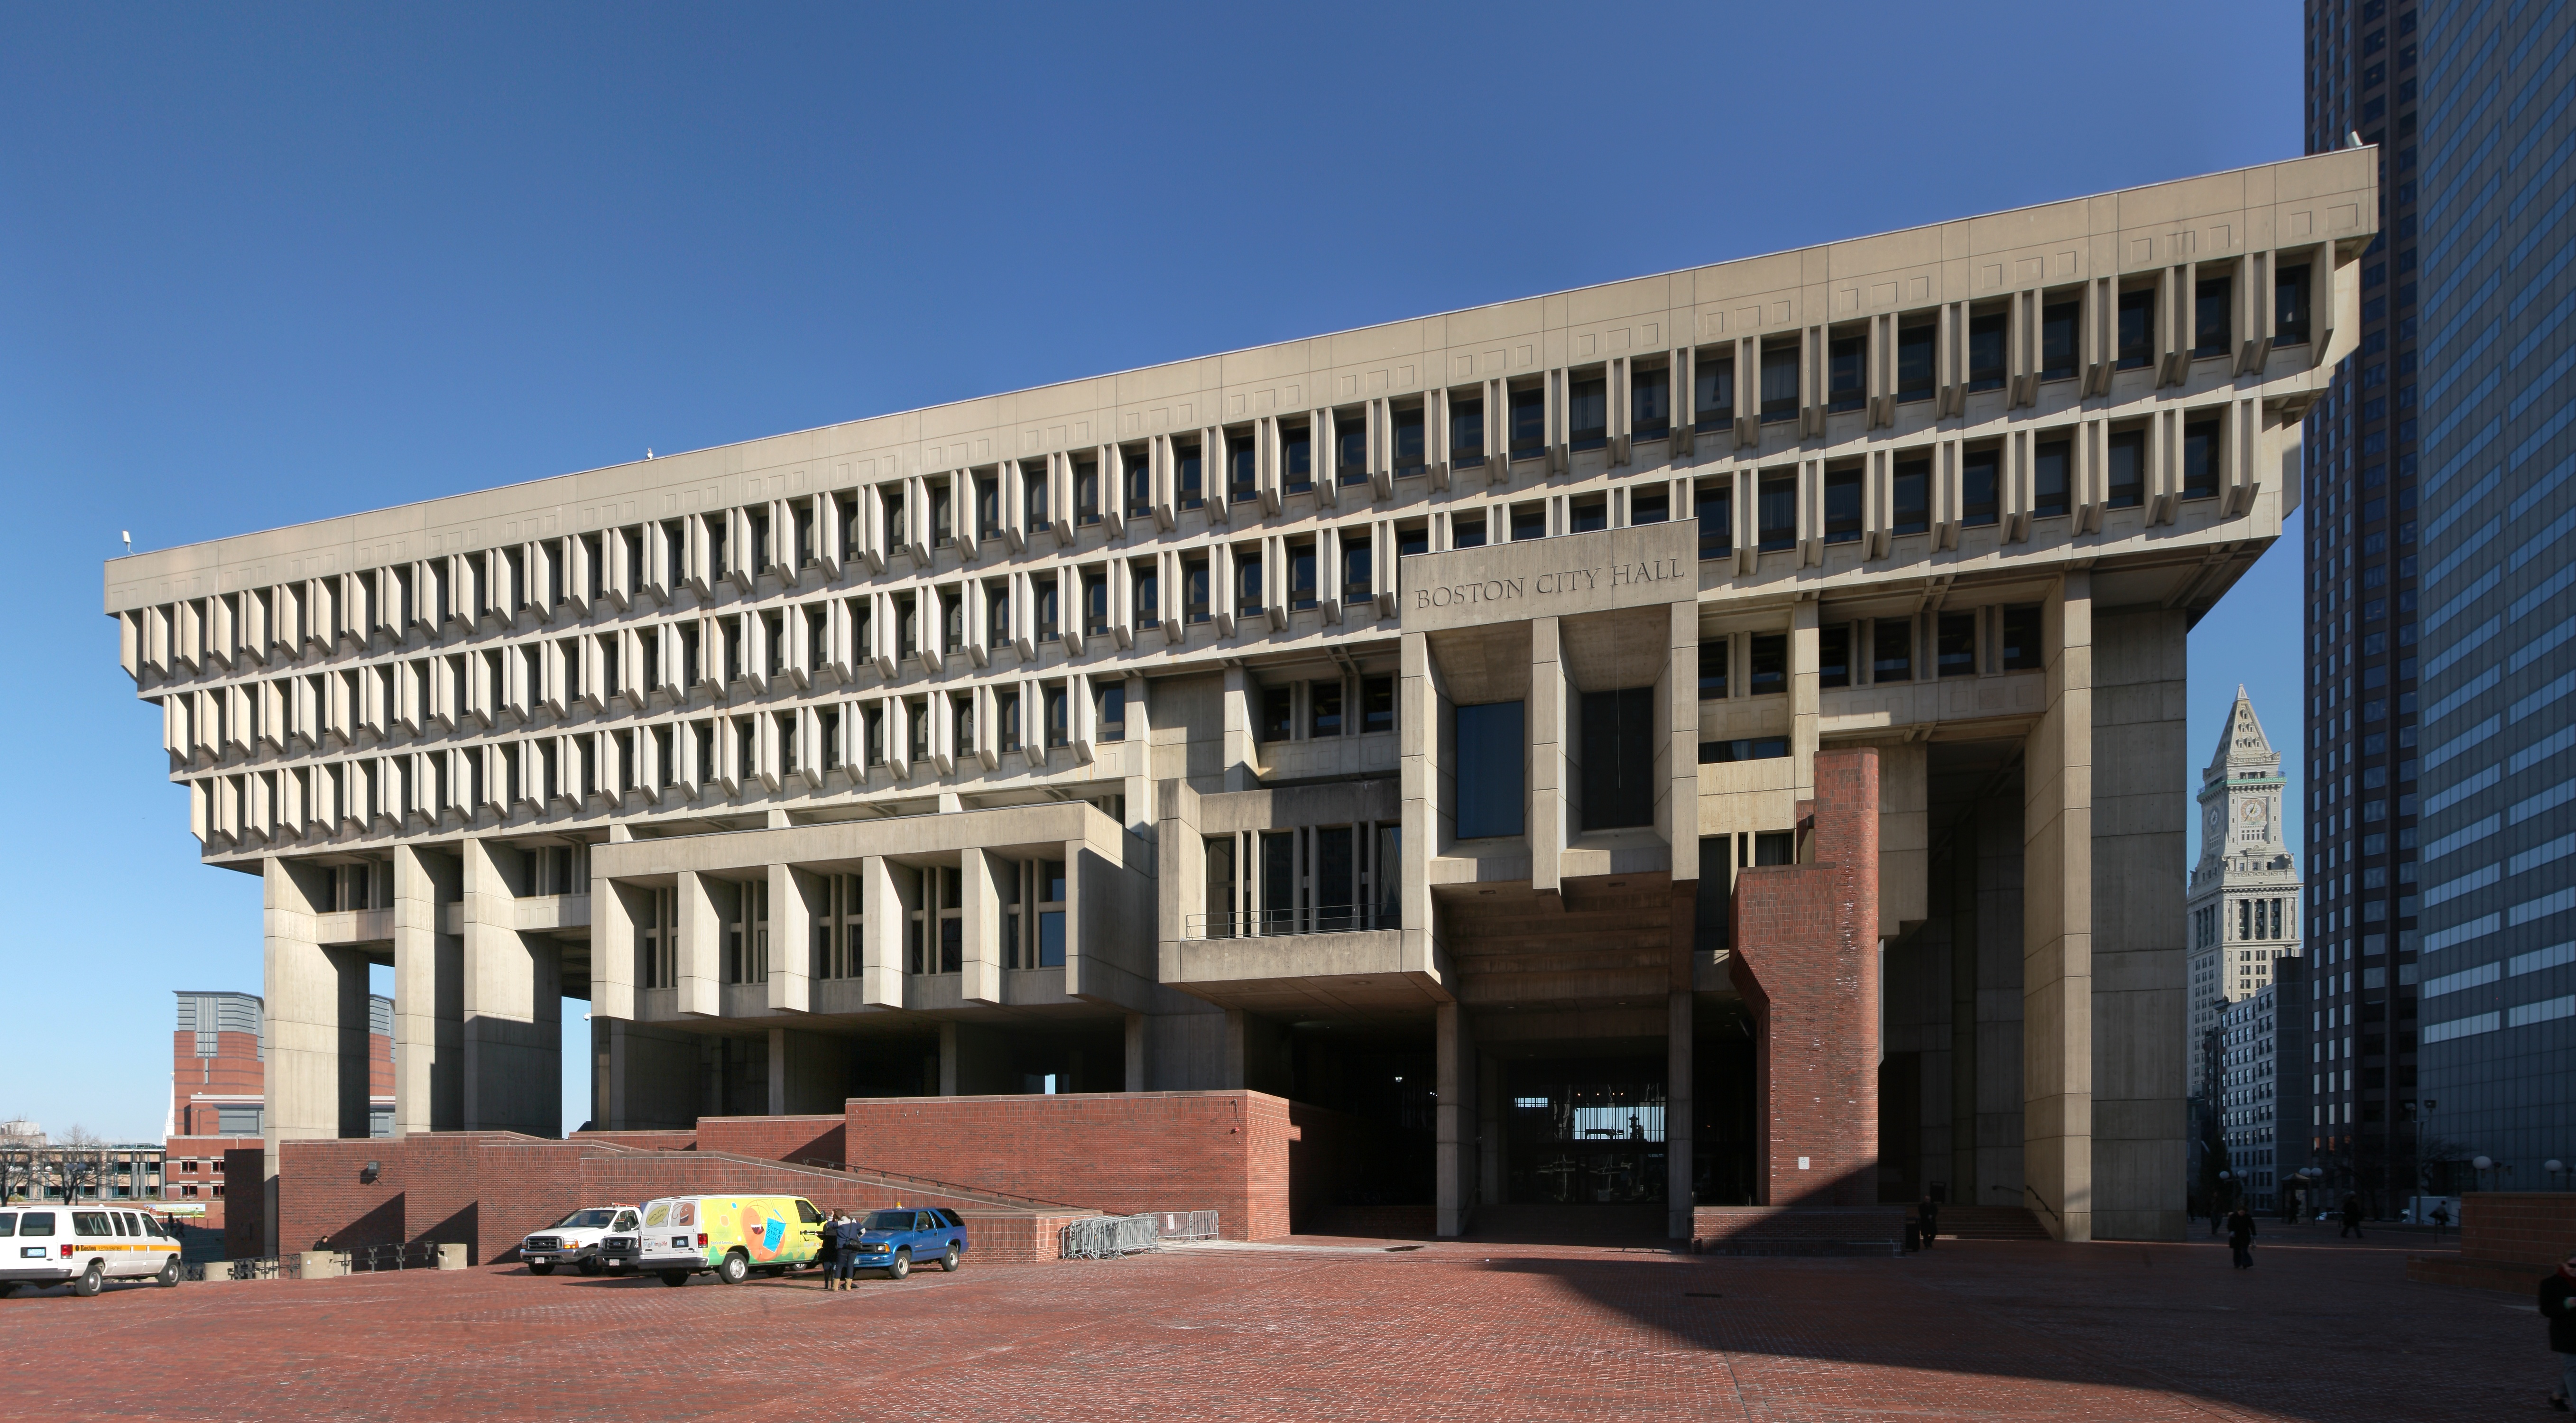
In the last chapter Monteyner goes a step further and applies his observations and investigations as an interpretation of an architectural style. He goes as far as arguing that this focus on shelter and bunker design has effectively led to an specific style, not a new one, but Brutalism?! Well thats something new and of course he has some evidence, the famous Boston City Hall. The basic argument is that Brutalist architecture looks a bit like bunk architecture so the origin of Brutalism is to be found in these government programs during the early Cold War times having shaped a whole generations concusses.
http://en.wikipedia.org/wiki/Brutalism
Image taken from Wikipedia / The Boston City Hall that serves as an example as to how bunker design has lead to the Brutalism movement.
Boston City Hall is at this point is the famous and widely debated example in the U.S. and serves well since it has implemented to some extend the requirements for fallout shelter. Interestingly the term Burtalism however is claimed to be coined by the Smithsons from the United Kingdom based on Le Corbusier in the context of CIAM. So not really an American connection there and all in all a bit too early for these programs that were run in the fifties and sixties mainly.
Reading the shelter guides these cold war programs produced and the resulting designs one can not help but smile. It amazing how naive the designs are and how improvised. For example there are guides on how to build a wooden shelter in your backyard and even the Boston City Hall project, the famous bunker style building has implemented shelter space on the eights floor?
It seemed to work and to some degree the American officials seemed to gain some sense of preparednes from these exercises. To everyone else these plans must immediately seem strange. If all you need to withstand a nuclear war is to build the entrance of a house not in line with the corridor to prevent fallout from penetrating deep into the house we ar all save.
American architecture is not generally well known for going deep underground and if possible basements are avoided at any cost. Very much so in terms of shelter and fall protection provision. Not even these programs have seriously considered building bunker underground, as the Boston City Hall projects demonstrates. Shelter can happily be provided on the eighth floor?!
The way this infrastructure of bunkers and shelters is described in the publication does echo practices for example in Switzerland. The small country in the heart of Europe is well known for its specific bunker infrastructure. On the military end this infrastructure was designed to guarantee the independence creating a réduit in the alps. On the civil side planning for large scale shelter infrastructure started a early as the 1930s. These efforts were geared towards the provision of shelter everyone in the country. Doring the 1980s this was achieved, making Switzerland arguably the leading provider of shelters.
It is a general requirement in Switzerland to built a shelter as part of every housing project ranging from a single family house to an entire block. Depending on the size of the project and number of inhabitants the shelter has to provide a certain capacity. Currently there are, according to the Swiss Federal Office for Civil Protection FOCP, about 360’000 individual shelters built as part of buildings and in addition some 2300 communal shelters. Hereby a shelter in general is a sort of mini bunker in the basement of every building constructed after 1963.

Image taken from Kanton Schwyz / Detailed section drawing showing the emergency exit from a standard single family house shelter space. Requirements including distances and dimensioning are based on standards applicable through out Switzerland. Note also the shown solution in case of high ground water.
There are clear guide lines for the construction of the shelter, the provisions and the equipment necessary. Every opening has to have a massive concrete door to completely seal the space. There is ventilation equipment required, designed to withstand gas and fall out. In addition there are simple bunk bed constructions and basic facilities such as dry toilets required.
Larger buildings such as community centres provide shelter for a larger number of people ranging from 30 to a few hundred. All are real bunkers constructed in full concrete, at least 25 cm in thickness with completely sealable openings, basic infrastructure equipment, toilets, beds and cooking facilities.
In addition infrastructure projects sometimes have been used to extend capacity of shelter place capacity. For examples the highway tunnel ‘Sonnenbergtunnel‘ in Luzern was build with the capacity to transform into a massive bunker if required. It would have provided places for about 20’000 people. This includes sanitary facilities including a small hospital unit, large kitchens, ventilation infrastructure and bunk beds and so on. In case of emergency each tunnel entrance would be closed with a specially designed massive concrete gates to seal the entrance. The entire length of the tunnel be used for cubicles with bunk beds. It was calculated for 1m2 of floorspace per person.

Image taken from Luzernerzeitung / The large gates of the Sonnenbergtunnel shelter in Switzerland were last closed in 1987. The gate is constructed on sight and is curved to withstand great pressure.
Sonnenberg tunnel is since 2005 no longer in operation as a shelter unit. It can still be visited with a guided tour though. The city of Luzern has in connection to the complete renovation of the highway A2 developed a new Civil Defence concept and provides the capacity in shelter places elsewhere. However, through out switzerland a number of other such invisible underground civi defence infrastructure buildings are still being maintained in order to provide shelter in case of war or nuclear fall out.
Switzerland has in many ways optimised and multiplied the implementation of shelter provision for the civil population. Reading it under the aspects David Monteyne presents in the introduction to his publication the outreach of the state to discipline the population to good behaviour in exchange for welfare did work and still works very well. It can be argued that the Swiss population and the architects as the implementers of these outreach programs cooperate well. However, the implementation of the shelter infrastructure is taken much more serious in its mechanics in Switzerland than according to Monteyne it was in the US. And from a Swiss perspective to speak of a specific bunker style (believed to be brutalism) to emerge from the state requirements for shelter seems absurd. This is mainly dueto the fact that Swiss planners have always decided that shelter or bunker facilities only really make sense if they are implemented in the basement and never tried to somehow fit it in above ground. As such the shelter has never been visible and therefore did not influence the ascetics of the aboveground appearance necessarily.
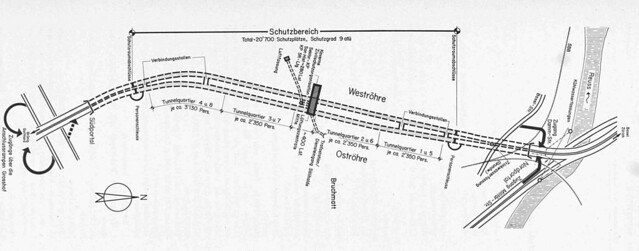
Details taken from: Heierli, W., Jundt, L. & Kessler, E., 1976. Die Zivilschutzanlage Sonnenbergtunnel in Luzern. Schweizerische Bauzeitung, 94(46), pp.689-699.
/ Map of the Sonnenberg highway tunnel near Luzern in Switzerland showing the location of the built shelter. The bunke was designed to provided space for 20’000 civilians in the case of war. Constructed between 1971 and 1976. The shelter was finally closed in 2005.
Details taken from: Heierli, W., Jundt, L. & Kessler, E., 1976. Die Zivilschutzanlage Sonnenbergtunnel in Luzern. Schweizerische Bauzeitung, 94(46), pp.689-699.
Building shelters underground could be an explanation why the required provision of shelter had and still has a much higher acceptance through out the civil population. Without it being constantly present in the everyday environment it is much more a background infrastructure than an style and other functions are not overloaded by the required provision of shelter but extended.
Nevertheless the book presents a very distinct characteristic of the last century and the period between 1950 and 1980. Whether it lead to a distinct architectural style can be debated. What is of specific interest is to compare the different approaches to the provision of shelter as well as what these approaches tell about how the civil society deals with chaos and order, the manipulation of the collective and the individual and the role of planning and architecture in a wider society context.

Image taken from amazon / Book cover.
Monteyne, D., 2011. Fallout Shelter: Designing for Civil Defense in the Cold War, University of Minnesota Press.
Continue reading »The Cold War years are usually presented in terms of the military force and an ever expanding resource of military equipment. This of course includes foremost the nuclear weapons both sides the West lead by the U.S. and the NATO and the Communist East lead by Russia.
Architecture however, played an important role in cicvil defence and the preparation for a potential third world war. There was far less attention payed to the fact that all nations had programs running to prepare their societies for the case of escalation. Tensions there were enough.
Nuclear war was the ultimate danger and with images and evidence form Hiroshima and Nagasaki preparation was part of civil defence programs also in the U.S. In a new book Fallout Shelter: Designing for Civil Defence in the Cold War published by University of Minnesota Press, David Monteyne presents these U.S. programs from an architectural perspective. This detailed investigation ranges from the propaganda to built examples and examines closely the role of the architect as the middle man between government and civil society implementing a plan that is further reaching than simply the provision of shelter. Find Fallout Shelter: Designing for Civil Defence in the Cold War for great prices with these Amazon Promo Codes.
Image taken from etsy / DIY fallout shelter for your back garden.
As Monteyne points out in his introduction it effectively is a contract between citizens and government exchanging provision for shelter and quality of live for cooperative behaviour. He refers to Foucaults biopower as a political relationship. Essentially building shelters was and in some cases still is, as we’ll discuss further on, the physical implementation of goals and powers of the welfare state.
The book explores in seven chapters the background, the planning, the implementation and the potential influence of shelter provision programs in the U.S. The programs were mostly about information and education but of course also aiming to build shelter provision. For this the architects were a key alley and the American Institute of Architects (AIA) launched a series of design competitions together with the Office for Civil Defense (OCD). The aim was to promote good planning and preparation for shelter provision. A series of designs were presented as winners, both built and as projects.
In the last chapter Monteyner goes a step further and applies his observations and investigations as an interpretation of an architectural style. He goes as far as arguing that this focus on shelter and bunker design has effectively led to an specific style, not a new one, but Brutalism?! Well thats something new and of course he has some evidence, the famous Boston City Hall. The basic argument is that Brutalist architecture looks a bit like bunk architecture so the origin of Brutalism is to be found in these government programs during the early Cold War times having shaped a whole generations concusses.
http://en.wikipedia.org/wiki/Brutalism
Image taken from Wikipedia / The Boston City Hall that serves as an example as to how bunker design has lead to the Brutalism movement.
Boston City Hall is at this point is the famous and widely debated example in the U.S. and serves well since it has implemented to some extend the requirements for fallout shelter. Interestingly the term Burtalism however is claimed to be coined by the Smithsons from the United Kingdom based on Le Corbusier in the context of CIAM. So not really an American connection there and all in all a bit too early for these programs that were run in the fifties and sixties mainly.
Reading the shelter guides these cold war programs produced and the resulting designs one can not help but smile. It amazing how naive the designs are and how improvised. For example there are guides on how to build a wooden shelter in your backyard and even the Boston City Hall project, the famous bunker style building has implemented shelter space on the eights floor?
It seemed to work and to some degree the American officials seemed to gain some sense of preparednes from these exercises. To everyone else these plans must immediately seem strange. If all you need to withstand a nuclear war is to build the entrance of a house not in line with the corridor to prevent fallout from penetrating deep into the house we ar all save.
American architecture is not generally well known for going deep underground and if possible basements are avoided at any cost. Very much so in terms of shelter and fall protection provision. Not even these programs have seriously considered building bunker underground, as the Boston City Hall projects demonstrates. Shelter can happily be provided on the eighth floor?!
The way this infrastructure of bunkers and shelters is described in the publication does echo practices for example in Switzerland. The small country in the heart of Europe is well known for its specific bunker infrastructure. On the military end this infrastructure was designed to guarantee the independence creating a réduit in the alps. On the civil side planning for large scale shelter infrastructure started a early as the 1930s. These efforts were geared towards the provision of shelter everyone in the country. Doring the 1980s this was achieved, making Switzerland arguably the leading provider of shelters.
It is a general requirement in Switzerland to built a shelter as part of every housing project ranging from a single family house to an entire block. Depending on the size of the project and number of inhabitants the shelter has to provide a certain capacity. Currently there are, according to the Swiss Federal Office for Civil Protection FOCP, about 360’000 individual shelters built as part of buildings and in addition some 2300 communal shelters. Hereby a shelter in general is a sort of mini bunker in the basement of every building constructed after 1963.
Image taken from Kanton Schwyz / Detailed section drawing showing the emergency exit from a standard single family house shelter space. Requirements including distances and dimensioning are based on standards applicable through out Switzerland. Note also the shown solution in case of high ground water.
There are clear guide lines for the construction of the shelter, the provisions and the equipment necessary. Every opening has to have a massive concrete door to completely seal the space. There is ventilation equipment required, designed to withstand gas and fall out. In addition there are simple bunk bed constructions and basic facilities such as dry toilets required.
Larger buildings such as community centres provide shelter for a larger number of people ranging from 30 to a few hundred. All are real bunkers constructed in full concrete, at least 25 cm in thickness with completely sealable openings, basic infrastructure equipment, toilets, beds and cooking facilities.
In addition infrastructure projects sometimes have been used to extend capacity of shelter place capacity. For examples the highway tunnel ‘Sonnenbergtunnel‘ in Luzern was build with the capacity to transform into a massive bunker if required. It would have provided places for about 20’000 people. This includes sanitary facilities including a small hospital unit, large kitchens, ventilation infrastructure and bunk beds and so on. In case of emergency each tunnel entrance would be closed with a specially designed massive concrete gates to seal the entrance. The entire length of the tunnel be used for cubicles with bunk beds. It was calculated for 1m2 of floorspace per person.
Image taken from Luzernerzeitung / The large gates of the Sonnenbergtunnel shelter in Switzerland were last closed in 1987. The gate is constructed on sight and is curved to withstand great pressure.
Sonnenberg tunnel is since 2005 no longer in operation as a shelter unit. It can still be visited with a guided tour though. The city of Luzern has in connection to the complete renovation of the highway A2 developed a new Civil Defence concept and provides the capacity in shelter places elsewhere. However, through out switzerland a number of other such invisible underground civi defence infrastructure buildings are still being maintained in order to provide shelter in case of war or nuclear fall out.
Switzerland has in many ways optimised and multiplied the implementation of shelter provision for the civil population. Reading it under the aspects David Monteyne presents in the introduction to his publication the outreach of the state to discipline the population to good behaviour in exchange for welfare did work and still works very well. It can be argued that the Swiss population and the architects as the implementers of these outreach programs cooperate well. However, the implementation of the shelter infrastructure is taken much more serious in its mechanics in Switzerland than according to Monteyne it was in the US. And from a Swiss perspective to speak of a specific bunker style (believed to be brutalism) to emerge from the state requirements for shelter seems absurd. This is mainly dueto the fact that Swiss planners have always decided that shelter or bunker facilities only really make sense if they are implemented in the basement and never tried to somehow fit it in above ground. As such the shelter has never been visible and therefore did not influence the ascetics of the aboveground appearance necessarily.
Details taken from: Heierli, W., Jundt, L. & Kessler, E., 1976. Die Zivilschutzanlage Sonnenbergtunnel in Luzern. Schweizerische Bauzeitung, 94(46), pp.689-699.
/ Map of the Sonnenberg highway tunnel near Luzern in Switzerland showing the location of the built shelter. The bunke was designed to provided space for 20’000 civilians in the case of war. Constructed between 1971 and 1976. The shelter was finally closed in 2005.
Details taken from: Heierli, W., Jundt, L. & Kessler, E., 1976. Die Zivilschutzanlage Sonnenbergtunnel in Luzern. Schweizerische Bauzeitung, 94(46), pp.689-699.
Building shelters underground could be an explanation why the required provision of shelter had and still has a much higher acceptance through out the civil population. Without it being constantly present in the everyday environment it is much more a background infrastructure than an style and other functions are not overloaded by the required provision of shelter but extended.
Nevertheless the book presents a very distinct characteristic of the last century and the period between 1950 and 1980. Whether it lead to a distinct architectural style can be debated. What is of specific interest is to compare the different approaches to the provision of shelter as well as what these approaches tell about how the civil society deals with chaos and order, the manipulation of the collective and the individual and the role of planning and architecture in a wider society context.
Image taken from amazon / Book cover.
Monteyne, D., 2011. Fallout Shelter: Designing for Civil Defense in the Cold War, University of Minnesota Press.
A quick weekend post – following on from our first look at CityEngine and Lumion we have expanded the visualisation to add in various standard items from the Lumion library along with a surrounding terrain and waterside setting:
Total developm…
Continue reading »A quick weekend post – following on from our first look at CityEngine and Lumion we have expanded the visualisation to add in various standard items from the Lumion library along with a surrounding terrain and waterside setting:
Total developm…
Continue reading »For a project on transport data I needed access to the National Rail timetables to calculate passing points for trains at every station. The National Public Transport Data Repository (NPTDR) TransXChange data is available for download on the data.gov.uk site, but it’s easier to download from the Department for Transport site: http://data.dft.gov.uk/NPTDR/index.html TransXChange is an … Read more →
Continue reading »Finding ways to effectively map population data is a big issue in spatial data visualization. The standard practice uses choropleth maps that simply colour administrative units based on the combined characteristics of the people that live there (see below). These maps are popular with cartographers for a couple of reasons. You get a clear sense that the …
Continue reading »I’ve created a new visualisation, a dasymetric map of housing demographics which you can see here, which attempts to improve on the common thematic (a.k.a. choropleth) maps – a traditional example is shown below – where areas across the country … Continue reading →
Continue reading »Yesterday a license for CityEngine landed on our desk from the nice people at ESRI and to be honest we were a little too excited for our own good, after all its only software. However, CityEngine and its integration with ESRI ArcGIS, while ma…
Continue reading »Yesterday a license for CityEngine landed on our desk from the nice people at ESRI and to be honest we were a little too excited for our own good, after all its only software. However, CityEngine and its integration with ESRI ArcGIS, while ma…
Continue reading »Agent-Based Models or Modelling, abbreviated ABM , involves developing simulations of urban structure and dynamics at the level of how individual objects which comprise such systems behave. The best example and the one that is developed in my lecture today … Continue reading →
Continue reading »