“explosive growth of agent modeling over the past two decades in the social sciences, in business and government, and related areas, and offer a tour d’horizon of its present state and myriad applications. Looking forward, we will identify challenges and opportunities — Hilbert Problems, if you will — to shape the future of agent-based computational modeling.”
 |
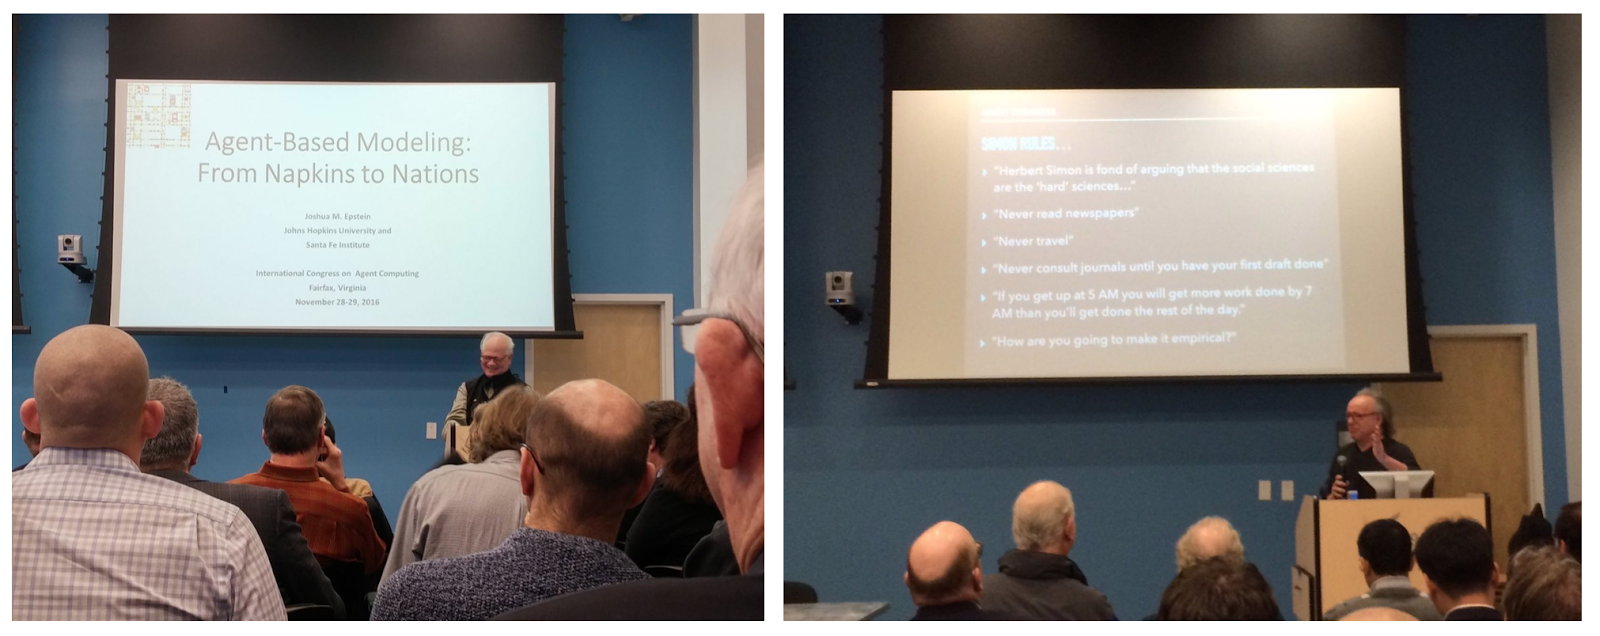
| Joshua Epstein and Robert Axtell presenting their works. |
Josh and Rob each gave really impressive talks entitled “Agent-based modeling: From Napkins to Nations” and “The Adoption of Agent Computing over Time by Social Scientists as Compared to Game Theory and Experimental/ Behavioral Economics” respectively. Which reflected how agent computing has evolved over the last 20 years with plenty of funny anecdotes along the way including references and critiques of their works such as “masculine gods of their cyberspace creations” and where the field is going.
What really impressed me about the congress was the atmosphere. That of like minded individuals from many different disciplines coming together and discussing agent computing, complexity and modeling more generally. Some of this can be seen via
photos and tweets of the event.
Alison Heppenstall,
Nick Malleson and myslef also participated at the congress with a talk entitled “
ABM for Simulating Spatial Systems: How are we doing?” which assessed how has agent-based modeling within the geographical sciences advanced over the last 20 years. Below one can read a brief outline of the talk and a movie of presentation.
Abstract:
While great advances in modeling have been made, one of the greatest challenges we face is that of understanding human behavior and how people perceive and behave in physical spaces. Can new sources of data (i.e. “big data”) be used to explore the connections between people and places? In this paper we will review of the current state of art of modeling geographical systems. We highlight the challenges and opportunities through a series of examples that new data can be used to better understand and simulate how individuals behave within geographical systems.
Key Words: Agent-based Modeling, Geographical Information Science, Networks, Cities, Geographical Systems.
Reference:
Heppenstall, A., Crooks A.T. and Malleson, N. (2016), ABM for Simulating Spatial Systems: How are we doing? International Congress on Agent Computing, 29th-30th, November, Fairfax, VA.
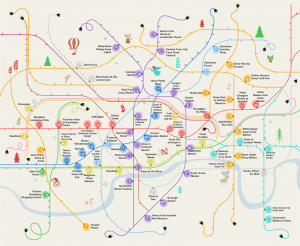
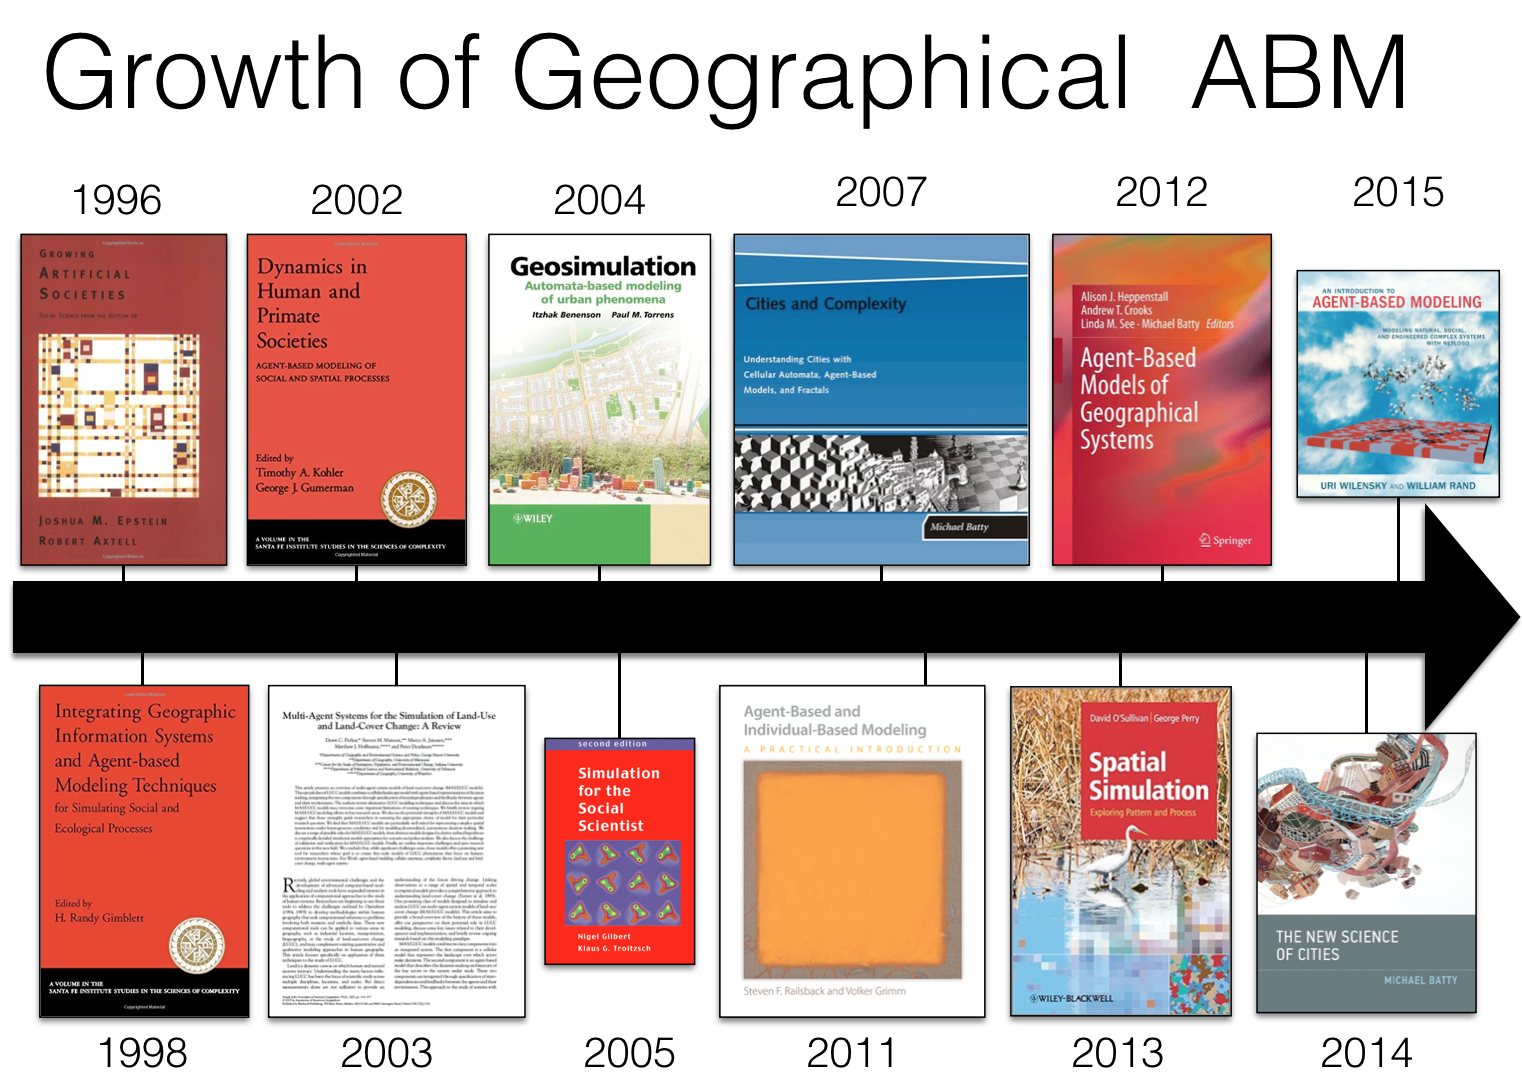
 |
| The Growth of Geographical ABM (selected examples). |
Continue reading »