Pigeon Sim- A fresh way to interact with urban data?
Thanks to an Xbox Kinect, Google Earth and some […]
Continue reading »The latest outputs from researchers, alumni and friends at the UCL Centre for Advanced Spatial Analysis (CASA).

Thanks to an Xbox Kinect, Google Earth and some […]
Continue reading »
Built in Unity 3D, this is an early attempt to create a simple model of energy consumption using agents and interactivity in a playful manner. Eve, the avatar from the infinite museum and her sisters, are looking for energy to grow. Once found, they no…
Continue reading »Built in Unity 3D, this is an early attempt to create a simple model of energy consumption using agents and interactivity in a playful manner. Eve, the avatar from the infinite museum and her sisters, are looking for energy to grow. Once found, they no…
Continue reading »
Built in Unity 3D, this is an early attempt to create a simple model of energy consumption using agents and interactivity in a playful manner. Eve, the avatar from the infinite museum and her sisters, are looking for energy to grow. Once found, they no…
Continue reading »

The founder and chair of CASA, Prof. Michael Batty has been awarded the prestigious Lauréat Prix International de Géographie Vautrin Lud, the highest award that can be gained in the field of geography. This prize is widely known as the “Nobel pri…
Continue reading »

Wireless in the world from Timo on Vimeo.

The globe tweeter visualizes real-time twits on a 3D globe project by Cedric Pinson (code development), Design by Guillaume Lecollinet, Node.js hacking Johan Euprhosine.
Downtrib, screened at Fulldome UK 2012.
Continue reading »The Washington Post recently released a front-page article claiming that “The federal government wants to create super WiFi networks across the nation…Cities support the idea because the networks would lower costs for schools and businesses…
Continue reading »
Wireless in the world from Timo on Vimeo.
The globe tweeter visualizes real-time twits on a 3D globe project by Cedric Pinson (code development), Design by Guillaume Lecollinet, Node.js hacking Johan Euprhosine.
Downtrib, screened at Fulldome UK 2012.
Continue reading »In the 2011-2012 MRes of Advanced Spatial Analysis and Visualization we worked on some fascinating topics and new year is always a good time to re-cap. The Infinite museum is the result of an interdisciplinary collaboration with Martin D…
Continue reading »

 |
| The museum of Unlimited Growth – Le Corbusier 1929 |
 |
| The infinite museum is a showcase for a range of visualization techniques such as images, videos, 3d objects and 3d animations. |
 |
| The application explores the possibilities of modular construction |
 |
| The application doesn’t rely on a pre-built structure, instead it dynamically creates a map of rooms whose topology is a result of player options and pre-defined exhibit relationships. |
 |
| The 6 rooms of the infinite museum |
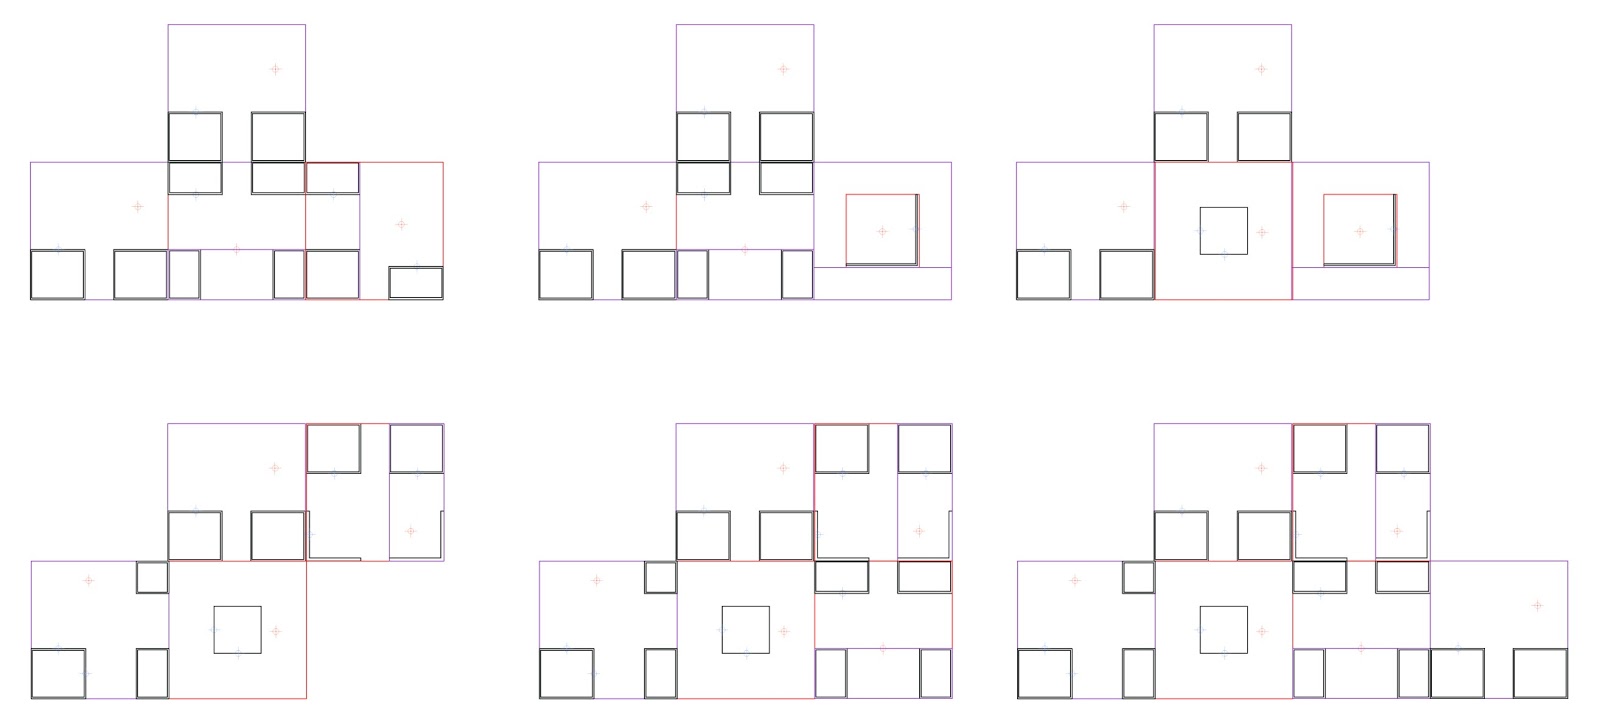 |
| The generation of different spaces is illustrated above using random formations. |
This blogpost contains extracts from our group essay.
Team Members, visit their blogs at:
Martin Dittus COVSPC
Ian Morton visual metro
Mohammad Masum Spatial Urban
Flora Roumpani En-topia

|
| The museum of Unlimited Growth – Le Corbusier 1929 |
|
| The infinite museum is a showcase for a range of visualization techniques such as images, videos, 3d objects and 3d animations. |
|
| The application explores the possibilities of modular construction |
|
| The application doesn’t rely on a pre-built structure, instead it dynamically creates a map of rooms whose topology is a result of player options and pre-defined exhibit relationships. |
|
| The 6 rooms of the infinite museum |
|
| The generation of different spaces is illustrated above using random formations. |
This blogpost contains extracts from our group essay.
Team Members, visit their blogs at:
Martin Dittus COVSPC
Ian Morton visual metro
Mohammad Masum Spatial Urban
Flora Roumpani En-topia
We are pleased to announce the availability of six fellowships are available to support individuals in non-academic institutions to undertake defined research projects at the Centre for Spatial Analysis and Policy (CSAP) in Leeds or the Centr…
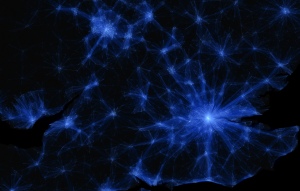
Continue reading »Robin of geotheory.org and a student on our MRes in Advanced Spatial Analysis and Visualisation course here at CASA, University College London has created an interesting movie looking at data from openflights.org.
Created in Processing the c…
Continue reading »Over the last few weeks we have been looking at ESRI’s CityEngine and how it can be used to create rapid urban scenes. As we noted it moves GIS visualisation a step forward while at the same time bringing procedural city modelling into the ma…
Continue reading »I recently had the pleasure of presenting at the first Data Visualisation London Meetup event where I spoke about some of work we do at UCL CASA. A fair chunk of the slides were movies so I thought it best to stick them in a blog post. If you like what you see you can …
Continue reading »CASA hosted a very successful Smart Cities event last Friday, including presentations from Carlo Ratti,…
Continue reading »The next assignment in the Visualization course of the MRes Advanced Spatial Analysis and Visualisation in CASA, was relevant to “Agent based modelling”. In this project the idea is to create a tool which loads the pixels …
Continue reading »The next assignment in the Visualization course of the MRes Advanced Spatial Analysis and Visualisation in CASA, was relevant to “Agent based modelling”. In this project the idea is to create a tool which loads the pixels …
Continue reading »The next assignment in the Visualization course of the MRes Advanced Spatial Analysis and Visualisation in CASA, was relevant to “Agent based modelling”. In this project the idea is to create a tool which loads the pixels …
Continue reading »Over the past few days we have been working on a series of techniques to visualise and augment procedural cities.
If you add in a model of a BenQ projector, the MRes in Advanced Spatial Analysis and Visualisation Handbook, a city within t…
Continue reading »Over the past few days we have been working on a series of techniques to visualise and augment procedural cities.
If you add in a model of a BenQ projector, the MRes in Advanced Spatial Analysis and Visualisation Handbook, a city within t…
Continue reading »In the MRes of Advanced Spatial Analysis and Visualisation in CASA, we are exploring various techniques that are relevant to urban modelling and visualisations, such as Cellular Automata (CA), Agents etc. These a…
Continue reading »In the MRes of Advanced Spatial Analysis and Visualisation in CASA, we are exploring various techniques that are relevant to urban modelling and visualisations, such as Cellular Automata (CA), Agents etc. These a…
Continue reading »In the MRes of Advanced Spatial Analysis and Visualisation in CASA, we are exploring various techniques that are relevant to urban modelling and visualisations, such as Cellular Automata (CA), Agents etc. These a…
Continue reading »“Take a cycle, ride it where you like, then return it, ready for the next person. Available 24 hours a day, all year round. It’s self-service and there’s no booking. Just turn up and go.” Barclays Cycle Hire is certainly popular in London. Every time a…
Continue reading »
“Take a cycle, ride it where you like, then return it, ready for the next person. Available 24 hours a day, all year round. It’s self-service and there’s no booking. Just turn up and go.” Barclays Cycle Hire is certainly popular in London. Every time a…
Continue reading »
“Take a cycle, ride it where you like, then return it, ready for the next person. Available 24 hours a day, all year round. It’s self-service and there’s no booking. Just turn up and go.” Barclays Cycle Hire is certainly popular in London. Every time a…
Continue reading »Over the past few weeks we have been exploring exploring new methods and techniques for visualising data. Developed as part our Masters course in Advanced Spatial Analysis and Visualisation we are now looking into issues of scale, realtime renderi…
Continue reading »Over the past few weeks we have been exploring exploring new methods and techniques for visualising data. Developed as part our Masters course in Advanced Spatial Analysis and Visualisation we are now looking into issues of scale, realtime renderi…
Continue reading »This week I feature on the 4th Episode of the Global Lab podcast. The podcast is a great new initiative led by Martin and Steve from CASA where they talk about cities, global connectivity and the impact of technology on people’s lives. Episode four features some horrendous physics jokes, Einstein’s Garden at the Green Man festival …
Continue reading »QRator is a collaborative project between the UCL Centre for Digital Humanities (UCLDH), UCL Centre for Advanced Spatial Analysis (CASA), and UCL Museums and Collections, to develop new kinds of content, co-curated by the public, museum curators, and academic researchers, to enhance museum interpretation, community engagement and establish new connections…
QRator is a collaborative project between the UCL Centre for Digital Humanities (UCLDH), UCL Centre for Advanced Spatial Analysis (CASA), and UCL Museums and Collections, to develop new kinds of content, co-curated by the public, museum curators, and …
Continue reading »QRator is a collaborative project between the UCL Centre for Digital Humanities (UCLDH), UCL Centre for Advanced Spatial Analysis (CASA), and UCL Museums and Collections, to develop new kinds of content, co-curated by the public, museum curators, and …
Continue reading »This is another great map animation from our friends in CASA. It is a year old now (almost to the day) but it remains one of the most engaging Twitter…
Continue reading »Buried deep in the ESRI (UK) website is a case study I helped put together showcasing some of the ways we use GIS (specifically ESRI products) within UCL Department of Geography and Centre for Advanced Spatial Analysis. ESRI (UK) co-sponsor my PhD research and I have had a very positive and productive relationship with the company. I …
Continue reading »University College London – UCL Centre for Advanced Spatial AnalysisFull TimeThe appointment will be on UCL Grade 8, salary range will be £39,510 – £46,635 per annum, inclusive of London Allowance.The Centre for Advanced Spatial Analysis, home of Dig…
Continue reading »