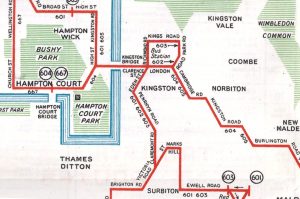
London Suburban Lines 1939 (Modern Reproduction)

This lovely schematic diagram was first created in 1939 by George Dow. It shows the three LNER (London and North Eastern Railway) north London networks – radiating out from the Marylebone, King’s Cross, and Liverpool Street/Fenchurch Street London terminii, in a single map. Unusually, the map includes a series of pictograms, illustrating nearby facilities, leisure […]

Continue reading »

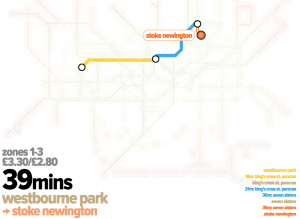
London Connections: A Geographic Tube Map

View the full map as a lovely vector PDF The Transport for London (TfL) tube map, with its straight lines, 45-degree rounded corners and simple, clear cartography, is a design classic. The map dispenses with other features such as parks, roads and urban extents – because you don’t need those if you are getting from […]

Continue reading »

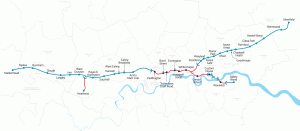
Mapping City Flows as Blood

Blood is everywhere when it comes to describing cities. We have arterial roads, pulsing transport flows, and cities with different metabolisms. Thanks to great new datasets and visualisation software the analogy of cities with pulsing flows is being increasingly utilised for explanatory mapping. For example the work of UCL CASA’s Jon Reades above depicts the London Underground network …

Continue reading »

Workshop- Mapping Social Interactions Online, Oxford Internet Institute


Last Friday (9thMarch), Oxford Internet Institute (OII) opened Internet research methodology workshop- Mapping Social Interactions Online at OII seminar room. It was one of OII’s successive workshop ‘Beyond Survey’ in 2011-2012.
This workshop was mainly composed of two parts. Dr Mark Graham led one part with the topic of Mapping with GIS and Dr Sandra Gonzalez-Bailon gave a lecture of social networks. Because the most participants are doing interdisciplinary researches which have a link to internet studies and they might not know well the methodologies of the studies, two lecturers introduced fundamental information and some basic program tools for further researches.
The research interest of Dr Mark Graham could be understood as ‘Intersection between ICT (Internet Communication Technology) and Geography’. He introduced GIS to catch and visualize invisible internet flows and social networks, and explained the concept of projection, the difference between Quantitative map and Qualitative map and some kinds of GIS programmes. While some professional GIS programmes like Arc GIS need a certain period of time to learn and utilize it, online mapping sites are more accessible for researchers and easy to create a map, therefore, he showed some online GIS websites and gave a demonstration to make a mapping on Google map by BatchGeo.com.
Below lists are the programmes and the sites which he mentioned during his lecture.

Arc GIS, Quantum GIS, TileMill, Geodesix, Mango Map, Geo IQ, BatchGeo

If you would like to know more about GIS, CASA website and their blogs should be useful.
Dr Sandra Gonzalez-Bailon provided a brief lecture about the structure of social networks. She drew simple but crucial questions like ‘What makes online networks different from offline networks?’ before starting a presentation, and she tried to resolve the questions. After introducing a historical timeline of network research, the importance of different social networks within one society and its meaning were suggested. During the lecture, she emphasized the implication what lies behind networks with multiple components and innumerable relationships of networks, and how characteristics of networks can be changed by these things. Like Dr Mark Graham, she showed some software to analyse online social networks and references which contain the contents of network theory.
The lists are below:

Social network analysis : methods and applications (1994)

Networks, Crowds, and Markets: Reasoning About a Highly Connected World (2010)

Networks: An Introduction (2010)

Exploratory Social Network Analysis with Pajek (2005)

Understanding Social Networks: Theories, Concepts, and Findings (2012)

NodeXL, Pajek, igraph,


This workshop was a good opportunity to know different approaches toward a similar topic not only research methodology but also its theoretical backgrounds. The lectures were energetic and provided interactive presentations. Some participants might want to see practical research processes of OII and how these methodologies can apply to their researches such as visualizing a relationship between online social interactions and geographical location. But, the lecturers agreed visualizing the relationship, which is my best attractive point, is a perplexing process and it needs a further development.

Continue reading »

Workshop- Mapping Social Interactions Online, Oxford Internet Institute


Last Friday (9thMarch), Oxford Internet Institute (OII) opened Internet research methodology workshop- Mapping Social Interactions Online at OII seminar room. It was one of OII’s successive workshop ‘Beyond Survey’ in 2011-2012.
This workshop was mainly composed of two parts. Dr Mark Graham led one part with the topic of Mapping with GIS and Dr Sandra Gonzalez-Bailon gave a lecture of social networks. Because the most participants are doing interdisciplinary researches which have a link to internet studies and they might not know well the methodologies of the studies, two lecturers introduced fundamental information and some basic program tools for further researches.
The research interest of Dr Mark Graham could be understood as ‘Intersection between ICT (Internet Communication Technology) and Geography’. He introduced GIS to catch and visualize invisible internet flows and social networks, and explained the concept of projection, the difference between Quantitative map and Qualitative map and some kinds of GIS programmes. While some professional GIS programmes like Arc GIS need a certain period of time to learn and utilize it, online mapping sites are more accessible for researchers and easy to create a map, therefore, he showed some online GIS websites and gave a demonstration to make a mapping on Google map by BatchGeo.com.
Below lists are the programmes and the sites which he mentioned during his lecture.

Arc GIS, Quantum GIS, TileMill, Geodesix, Mango Map, Geo IQ, BatchGeo

If you would like to know more about GIS, CASA website and their blogs should be useful.
Dr Sandra Gonzalez-Bailon provided a brief lecture about the structure of social networks. She drew simple but crucial questions like ‘What makes online networks different from offline networks?’ before starting a presentation, and she tried to resolve the questions. After introducing a historical timeline of network research, the importance of different social networks within one society and its meaning were suggested. During the lecture, she emphasized the implication what lies behind networks with multiple components and innumerable relationships of networks, and how characteristics of networks can be changed by these things. Like Dr Mark Graham, she showed some software to analyse online social networks and references which contain the contents of network theory.
The lists are below:

Social network analysis : methods and applications (1994)

Networks, Crowds, and Markets: Reasoning About a Highly Connected World (2010)

Networks: An Introduction (2010)

Exploratory Social Network Analysis with Pajek (2005)

Understanding Social Networks: Theories, Concepts, and Findings (2012)

NodeXL, Pajek, igraph,


This workshop was a good opportunity to know different approaches toward a similar topic not only research methodology but also its theoretical backgrounds. The lectures were energetic and provided interactive presentations. Some participants might want to see practical research processes of OII and how these methodologies can apply to their researches such as visualizing a relationship between online social interactions and geographical location. But, the lecturers agreed visualizing the relationship, which is my best attractive point, is a perplexing process and it needs a further development.

Continue reading »
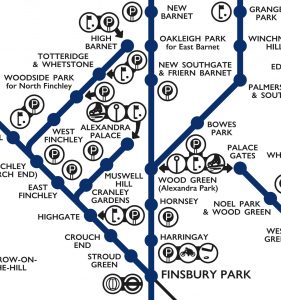
Network Population Density for Southwark

Using the excellent SANET extension for ArcGIS 9.3 I was able to take some of my data for Southwark that I had geocoded to address level, and estimate the population density using the OS Mastermap ITN product. The procedure is essentially a Kernel Density Estimation that takes place on a given network rather than across 2D space, this effectively controls […]

Continue reading »