Dot Density Mapping the European Population
Creating a giant dot density map using R.
Continue reading »The latest outputs from researchers, alumni and friends at the UCL Centre for Advanced Spatial Analysis (CASA).

Creating a giant dot density map using R.
Continue reading »The Register |
Dr Hannah Fry: We need to be wary of algorithms behind closed doors
The Register Dr Fry is a lecturer in the mathematics of cities at the Centre for Advanced Spatial Analysis at UCL, where her research “revolves around the study of complex social and economic systems at various scales, from the individual to the urban, regional and … |
Dr Hannah Fry: We need to be wary of algorithms behind closed doors The Register
Continue reading »Dr Hannah Fry: We need to be wary of algorithms behind closed doors The RegisterInterview Sure, algorithms are insanely useful, but we need to watch we don’t become complacent and unable to question them, University College London’s Dr …
Continue reading »Dr Hannah Fry: We need to be wary of algorithms behind closed doors The RegisterInterview Sure, algorithms are insanely useful, but we need to watch we don’t become complacent and unable to question them, University College London’s Dr …
Continue reading »Dr Hannah Fry: We need to be wary of algorithms behind closed doors The RegisterInterview Sure, algorithms are insanely useful, but we need to watch we don’t become complacent and unable to question them, University College London’s Dr …
Continue reading »Read our paper by Batty, Lin and Chen on Virtual Realities, Analogies and Technologies in Geography, where we continue to parade the idea of virtual geographic environments – VGE From the publisher’s blurb: This Handbook offers an insightful and comprehensive overview from … Continue reading →
Continue reading »
Following a data release of Southwark’s publically maintained trees a couple of years back, the Greater London Authority recently published a map which shows street trees (trees along roads and public paths, and trees in public open spaces, such as small parks and other minor green areas). Each borough has its own tree database and […]
Continue reading »
Figure 1: Map Mashup of Twitter data, where eachdotrepresents a tweet, the text corresponds to the selected tweet marked with a starIn the recently released “The International Encyclopedia of Geography: People, the Earth, Environment, and Technolo…
Continue reading »
Figure 1: Map Mashup of Twitter data, where eachdotrepresents a tweet, the text corresponds to the selected tweet marked with a starIn the recently released “The International Encyclopedia of Geography: People, the Earth, Environment, and Technolo…
Continue reading »

In the recently released “The International Encyclopedia of Geography: People, the Earth, Environment, and Technology” I was asked to write a brief entry on “Cellular Automata“. Below is the abstract to my chapter, along some of the images I used in my discussion, the full reference to the chapter.
Abstract:
Cellular Automata (CA) are a class of models where one can explore how local actions generate global patterns through well specified rules. In such models, decisions are made locally by each cell which are often arranged on a regular lattice and the patterns that emerge, be it urban growth or deforestation are not coordinated centrally but arise from the bottom up. Such patterns emerge through the cell changing its state based on specific transition rules and the states of their surrounding cells. This entry reviews the principles of CA models, provides a background on how CA models have developed, explores a range of applications of where they have been used within the geographical sciences, prior to concluding with future directions for CA modeling.
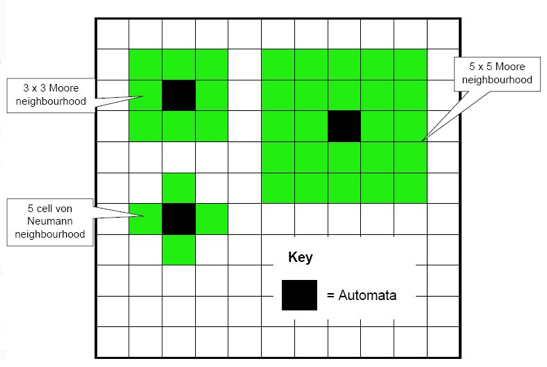 |
| Figure 1: Two-Dimensional Cellular Automata Neighborhoods |
 |
| Figure 2: Voronoi Tessellations Of Space Where Each Polygon Has A Different Number Of Neighbors Based On A Shared Edge. |
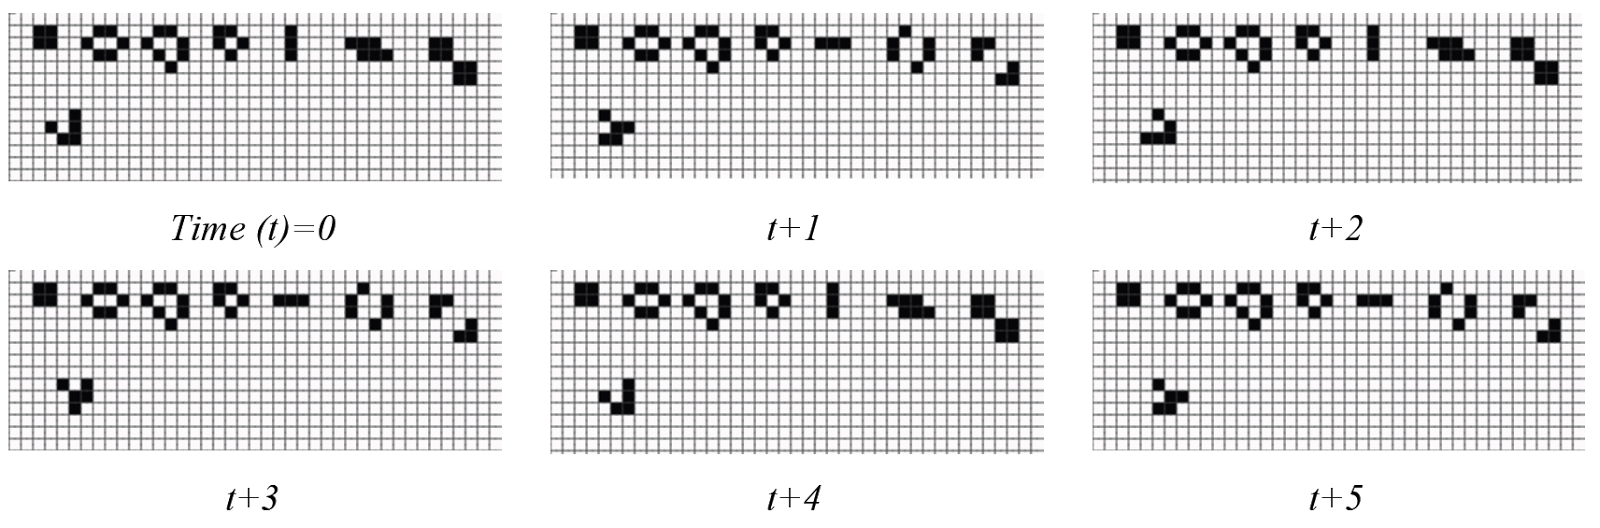 |
| Figure 3: Example of Cells Changing State from Dead (White) To Alive (Black) Over Time Depending On The States of its Neighboring Cells. |
 |
| Figure 4: A One-Dimensional CA Model Implementing “Rule 30” Where Successive Iterations Are Presented Below Each Other. |
Full Reference:
Continue reading »Crooks, A.T. (2017), Cellular Automata, in Richardson, D., Castree, N., Goodchild, M. F., Kobayashi, A. L., Liu, W. and Marston, R. (eds.), The International Encyclopedia of Geography: People, the Earth, Environment, and Technology, Wiley Blackwell. DOI: 10.1002/9781118786352.wbieg0578. (pdf)

In the recently released “The International Encyclopedia of Geography: People, the Earth, Environment, and Technology” I was asked to write a brief entry on “Cellular Automata“. Below is the abstract to my chapter, along some of the images I used in my discussion, the full reference to the chapter.
Abstract:
Cellular Automata (CA) are a class of models where one can explore how local actions generate global patterns through well specified rules. In such models, decisions are made locally by each cell which are often arranged on a regular lattice and the patterns that emerge, be it urban growth or deforestation are not coordinated centrally but arise from the bottom up. Such patterns emerge through the cell changing its state based on specific transition rules and the states of their surrounding cells. This entry reviews the principles of CA models, provides a background on how CA models have developed, explores a range of applications of where they have been used within the geographical sciences, prior to concluding with future directions for CA modeling.
|
| Figure 1: Two-Dimensional Cellular Automata Neighborhoods |
|
| Figure 2: Voronoi Tessellations Of Space Where Each Polygon Has A Different Number Of Neighbors Based On A Shared Edge. |
|
| Figure 3: Example of Cells Changing State from Dead (White) To Alive (Black) Over Time Depending On The States of its Neighboring Cells. |
|
| Figure 4: A One-Dimensional CA Model Implementing “Rule 30” Where Successive Iterations Are Presented Below Each Other. |
Full Reference:
Continue reading »Crooks, A.T. (2017), Cellular Automata, in Richardson, D., Castree, N., Goodchild, M. F., Kobayashi, A. L., Liu, W. and Marston, R. (eds.), The International Encyclopedia of Geography: People, the Earth, Environment, and Technology, Wiley Blackwell. DOI: 10.1002/9781118786352.wbieg0578. (pdf)

Remote Sensing in Ecology and Conservation is a new open access journal, addressing the interdisciplinary field that links different aspects of remote sensing (the use of different imaging and sensing technologies) and the field of ecology and conservation. It is publishing its papers in Open Access, so the papers are free to download and share. … Continue reading Call for Papers in a special issue of Remote Sensing in Ecology and Conservation on citizen science![]()
I recently stumbled upon a great dataset. It’s the first to provide comprehensive data for world city sizes as far back as 3700BC. The authors (Meredith Reba, Femke Reitsma & Karen Seto) write: How were cities distributed globally in the past? How many people lived in these cities? How did cities influence their local and regional […]
Continue reading »In a previous blog post, I presented QGIS enhancement #91, which aims at providing the infrastructure in QGIS to author, consume and share standards-based metadata (e.g.: ISO). In this post I would like to focus on a specific WP which … Continue reading →![]()
Support to standards based metadata (e.g.: ISO) has been greatly missed in QGIS. We would like for that to no longer be the case in QGIS 3.0, with this enhancement proposal. This blog post focuses on WP3: “QGIS Metadata Store”, … Continue reading →![]()
The special issue of the Human Computation Journal (see the details of the editorial here), summarises the result from the EU FP7 “Citizen Cyberlab” project. One of the outcomes of the project is the development of the GeoKey platform for participatory mapping. Therefore, a paper that was written with Oliver Roick and Claire Ellul explains … Continue reading Paper: GeoKey – open infrastructure for community mapping and science![]()

My latest London data visualisation crunches an interesting dataset from the Department of Transport. The data is available across England, although I’ve chosen London in particular because of its more interesting (i.e. not just car dominated) traffic mix. I’ve also focused on just the data for 8am to 9am, to examine the height of the … Continue reading Evolution of London’s Rush Hour Traffic Mix →
Continue reading »