Over the last few months I have been teaching a class in the
Department of Computational Social Science entitled “Building Virtual Worlds” where we surveyed the role of virtual worlds for social science research. The emphasis of the class was on tools, software frameworks, and applications of virtual worlds. On the applications side we discussed how virtual worlds are being used for History, Archeology, Healthcare, Tourism, Urban Modeling, Architecture, Agent-based Modeling along with more generally teaching and learning. We explored a variety of tools for building virtual worlds before focusing on
OpenSim. The movie below shows some of the final outputs using OpenSim.
We used OpenSim 0.7.3, configured with the Standalone-Hypergrid mode and a SQLite database hosted on a Windows 7 server. The server simultaneously simulated 64 different regions, and at various points during the semester the server hosted well over 15000 primitives (prims) and ran hundreds of scripts across this landscape; one region alone hosted over 8000 prims.
Why so many regions? We were interested in how many the server could cope with but also we wanted to have a virtual world representing the whole of the
GMU Fairfax campus (~4km
2) and regions in OpenSim are limited to 256m by 256m. We built the terrain for the campus utilizing the
National Elevation Dataset (NED) DEM from the United States Geological Survey which was first manipulated in
ArcGIS before being processed in
L3DT (Large 3D Terrain Generator). Finally, the DEM was imported into OpenSim. The movie below should give a sense of what the basic terrain looks like.
Once the terrain was built, we populated it with buildings, however, we were not just interested in the external appearance of the buildings but also there internal structure for modeling and simulation purposes. Therefore the class focused their attention on building a highly detailed
Johnson Center.
 |
| Model of Johnson Center taken from Google SketchUp 3D Warehouse |
Vector based, 2D CAD files were obtained and imported into
Google SketchUp before using
SketchLife to build the 3D initial building core, walls, doors and windows.
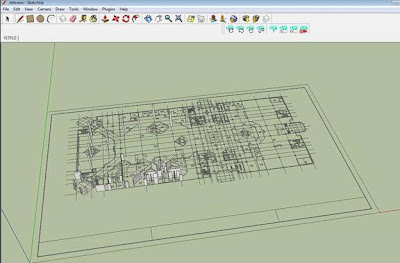 |
| Constructing a vector-based model of the Johnson Center internal structure |
 |
|
The SketchLife final rendering of the Johnson Center
|
Once built in SketchUp using SketchLife the model was imported into OpenSim
 |
| External view “in world” of what we accomplished in building the Johnson Center |
In addition to using SketchLife for the JC, many objects such as chairs, staircases and tables were either built using the tool or those native to OpenSim.
 |
An “in world” shot at ground level, on the 1st floor, viewing the atrium and clock tower
in the Johnson Center |
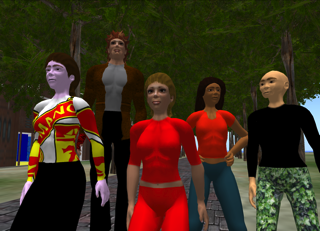 |
| CSS class photo “in-world” |
However, our work with OpenSim does not stop here, below is another movie of some ongoing work with one of our PhD students, Chris Rouly who is creating agent-based models embedded in OpenSim to explore past habitats among many other things.
I would like to thank the “Building Virtual Worlds” class and the Department for enabling this blog post.
Continue reading »