Tweets vs Flickr Photos – Eric Fischer’s City Maps
Eric Fischer produced this interesting data map of Lond […]
Continue reading »The latest outputs from researchers, alumni and friends at the UCL Centre for Advanced Spatial Analysis (CASA).

Eric Fischer produced this interesting data map of Lond […]
Continue reading » So, let’s say you want to meet up with your friends. You text – “Where are you?”. “We’re at the Bar Bar on 59th Street”, they reply. Now you need to look the place up, and navigate your way there.
Instead, why can’t your friend just…
I promised I would try and avoid general knowledge teasers, but I just really like this question – so I hope that you’ll forgive me, just this once. There are…
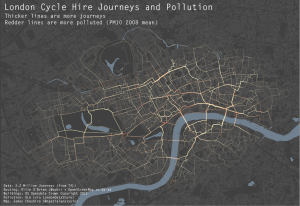
Continue reading »“Take a cycle, ride it where you like, then return it, ready for the next person. Available 24 hours a day, all year round. It’s self-service and there’s no booking. Just turn up and go.” Barclays Cycle Hire is certainly popular in London. Every time a…
Continue reading »
“Take a cycle, ride it where you like, then return it, ready for the next person. Available 24 hours a day, all year round. It’s self-service and there’s no booking. Just turn up and go.” Barclays Cycle Hire is certainly popular in London. Every time a…
Continue reading »
“Take a cycle, ride it where you like, then return it, ready for the next person. Available 24 hours a day, all year round. It’s self-service and there’s no booking. Just turn up and go.” Barclays Cycle Hire is certainly popular in London. Every time a…
Continue reading »I’ve recently been extracting some river geometries for major cities around the world. The data needs to be a list of latitude/longitude coordinates, representing the nodes on the shape for the river concerned. I’m sure there’s easier ways to do … Continue reading →
Continue reading »How exactly are we using light? Are we lighting what we need or are we lighting the surrounding plus everything else, wasting energy? Light has become a resource in our western societies that is being taken as a given available with the flick of a fing…
Continue reading »How exactly are we using light? Are we lighting what we need or are we lighting the surrounding plus everything else, wasting energy? Light has become a resource in our western societies that is being taken as a given available with the flick of a fing…
Continue reading »As reported on today’s BBC Technology, Oxfam has launched its new Shelflife system linking goods with the past using QRCodes.
Ever wished an object could tell its story? That’s the idea behind Oxfam’s
unique pilot scheme, Oxfam Shelfl…
As reported on today’s BBC Technology, Oxfam has launched its new Shelflife system linking goods with the past using QRCodes.
Ever wished an object could tell its story? That’s the idea behind Oxfam’s
unique pilot scheme, Oxfam Shelfl…
AAG Presentation – New York.
Continue reading »As part of the MRes in Advanced Spatial Analysis and Visualisation, here in CASA, we are exploring various concepts relating to urban visualisation. These include both traditional urban based modelling approaches and more abstract visualisations and si…
Continue reading »As part of the MRes in Advanced Spatial Analysis and Visualisation, here in CASA, we are exploring various concepts relating to urban visualisation. These include both traditional urban based modelling approaches and more abstract visualisations and si…
Continue reading »The Mapping London blog is 1 year today! We launched on […]
Continue reading »I presented at the CASA Seminar Series yesterday on the topic of business centre specialisation…
Continue reading »A few of my academic followers on Twitter (@frogo if your thinking of following me) asked recently what software I used on my Mac. As recent converts from Windows they want to get going and start using there shiny new fruit based computer and so this post is for them. It lists, in no particular order […]
Continue reading »Rank Clocks are a type of visualisation invented by Prof Michael Batty here at UCL CASA. They are time-based line charts, wrapped around a clockface – with the start date at the top, wrapping around clockwise to the end date. … Continue reading →
Continue reading »This week a word puzzle: Which plural noun in the English language becomes singular when you add an s? As ever, please feel free to gloat in the comments section below…..
Continue reading »From here you can download the lecture notes from my latest LTCC course: Complex Systems Dynamics. Week 1: Powerpoint slides: Part I, Part II Written notes: Part I, Part II…
Continue reading »Traditionally Geographic Information System (GIS) have been exclusively run on the Windows platform. Only very few applications run on either cross platform or exclusively on the Mac. This is part two of a review and introduction to Cartographica, a Mac based GIS software. Find part one with a general introduction HERE and the working with section HERE. This third part is looking at the mobile version for your iPhone or the iPad.
The GIS software are generally quite heavy software packages and with all them functions packed in use a fair bit of processing power. A mobile client is not quite the first choice as a platform for such an app. However, the field is where you get your data from, check on changes or record problems. Having a powerful GIS bases system right there to record the information and look up details makes your life so much easier and quite a bit more fun.
With the new quite powerful handheld devices running iOS this has become a reality and both iPad and iPhone rund GIS packages. Cartographica is offering a Cartographica Mobile app, currently at version 1.1 available now from the itunes app store.
With it you can take data with you out into the field. This is as simple as dropping files into your itunes. It will natively read shape files for example. Each file can be accessed from the mobile app, including layers.
Testing this HERE is a download link for Boris Bike station locations in London from the Guardian Datastore. The data can then be droppend into itunes and opened on the iPad.
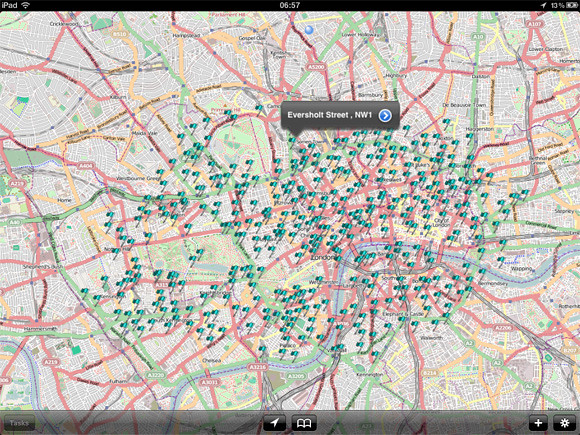
Image by urbanTick / Accessing the data on your iPad. Here showing the Boris Bike station location around London. As a background OSM is used by default.
You can then zoom in and get to the details that are stored with each data point. This is flexible and can be adjusted to the need even out in the field. As done here an field for photo is added and for each location an Photograph can be recorded and linked in directly form the iPad.
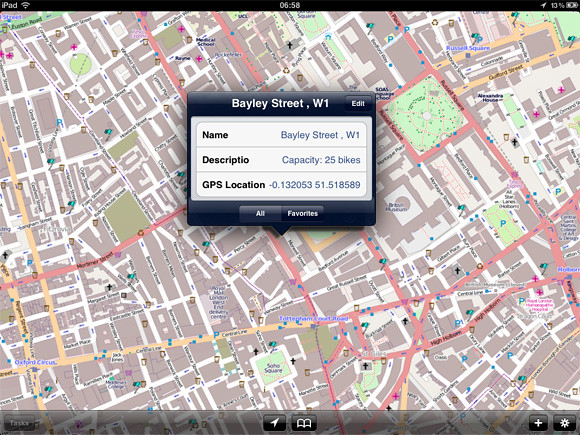
Image by urbanTick / Accessing the data on your iPad. Here showing the Boris Bike station location around London. The details can be accessed individually.
Beside looking at the data and access it new data points can be created. There is a plus button at the bottom of the screen or by keeping your finger on the screen also will bring up a zoom functions with witch a point can be manually located. Alternatively the GPS can be used to add a point at the current location.
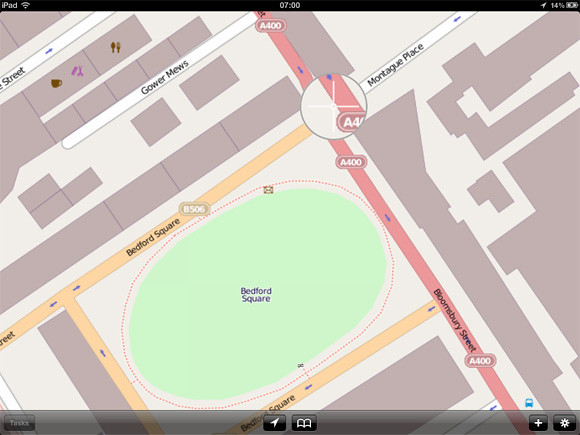
Image by urbanTick / Adding data directly on your iPad. The cross zoom helps definitely place a new data point.
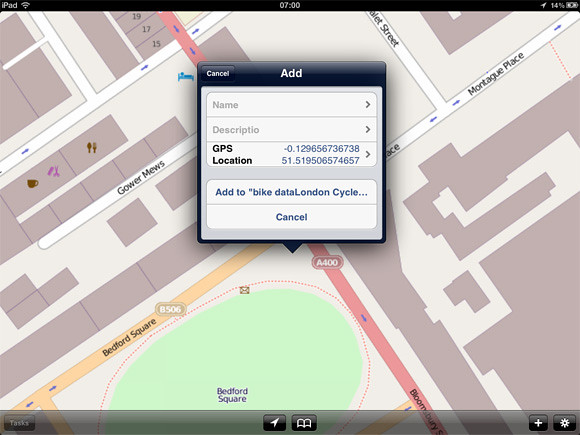
Image by urbanTick / Adding data directly on your iPad. The pop up dialoge lets you fill in the preset fields. Those can be manipulated on the go and new ones can be added or old ones deleted.
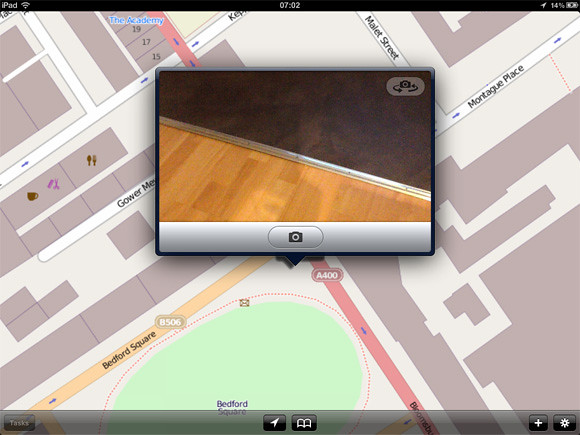
Image by urbanTick / Adding data directly on your iPad. Using the iPad camera to add photographs of the location, or anything else.
What can’t be done on the go is any processing. The station platform of Cartographica offers a range of tools to analyse and visualise the data (see previous post HERE.) The mobile verson as of now does not include any of this. As such the mobile app goes as an addon rather than a replacement. It is intended to take the data with you check, extend or create and bring it back for analysis and further processing.
Nevertheless, Cartographica Mobile does integrate with a network and multiple users including live updating. This opens up possibility for collaborative work on the move and in the field. This is very need and helpful in many cases.
The Cartographica Mobile version is available from the itunes app store at a price of £54.99 or the equivalent of your currrency. It is available world wide. The Cartographica workstation software is available form the web store at a price of $495 and as an academic student license for only $99 for one year. This is tremendously good offer, especially if compared to some of the other packages prices.
Continue reading »Traditionally Geographic Information System (GIS) have been exclusively run on the Windows platform. Only very few applications run on either cross platform or exclusively on the Mac. This is part two of a review and introduction to Cartographica, a Mac based GIS software. Find part one with a general introduction HERE and the working with section HERE. This third part is looking at the mobile version for your iPhone or the iPad.
The GIS software are generally quite heavy software packages and with all them functions packed in use a fair bit of processing power. A mobile client is not quite the first choice as a platform for such an app. However, the field is where you get your data from, check on changes or record problems. Having a powerful GIS bases system right there to record the information and look up details makes your life so much easier and quite a bit more fun.
With the new quite powerful handheld devices running iOS this has become a reality and both iPad and iPhone rund GIS packages. Cartographica is offering a Cartographica Mobile app, currently at version 1.1 available now from the itunes app store.
With it you can take data with you out into the field. This is as simple as dropping files into your itunes. It will natively read shape files for example. Each file can be accessed from the mobile app, including layers.
Testing this HERE is a download link for Boris Bike station locations in London from the Guardian Datastore. The data can then be droppend into itunes and opened on the iPad.
Image by urbanTick / Accessing the data on your iPad. Here showing the Boris Bike station location around London. As a background OSM is used by default.
You can then zoom in and get to the details that are stored with each data point. This is flexible and can be adjusted to the need even out in the field. As done here an field for photo is added and for each location an Photograph can be recorded and linked in directly form the iPad.
Image by urbanTick / Accessing the data on your iPad. Here showing the Boris Bike station location around London. The details can be accessed individually.
Beside looking at the data and access it new data points can be created. There is a plus button at the bottom of the screen or by keeping your finger on the screen also will bring up a zoom functions with witch a point can be manually located. Alternatively the GPS can be used to add a point at the current location.
Image by urbanTick / Adding data directly on your iPad. The cross zoom helps definitely place a new data point.
Image by urbanTick / Adding data directly on your iPad. The pop up dialoge lets you fill in the preset fields. Those can be manipulated on the go and new ones can be added or old ones deleted.
Image by urbanTick / Adding data directly on your iPad. Using the iPad camera to add photographs of the location, or anything else.
What can’t be done on the go is any processing. The station platform of Cartographica offers a range of tools to analyse and visualise the data (see previous post HERE.) The mobile verson as of now does not include any of this. As such the mobile app goes as an addon rather than a replacement. It is intended to take the data with you check, extend or create and bring it back for analysis and further processing.
Nevertheless, Cartographica Mobile does integrate with a network and multiple users including live updating. This opens up possibility for collaborative work on the move and in the field. This is very need and helpful in many cases.
The Cartographica Mobile version is available from the itunes app store at a price of £54.99 or the equivalent of your currrency. It is available world wide. The Cartographica workstation software is available form the web store at a price of $495 and as an academic student license for only $99 for one year. This is tremendously good offer, especially if compared to some of the other packages prices.
It is four years today since MapTube was launched at the Barbican and to mark this event, I’ve made some changes to how the home page displays. This is a bit of an experiment, but I’ve tried to make the home page display topical data by using RSS feeds from the BBC News page, the … Read more →
Continue reading »

Find out more see: @maksim2042, @JackieKazil & @ElectionGauge or at Tech Cocktail
Continue reading »Find out more see: @maksim2042, @JackieKazil & @ElectionGauge or at Tech Cocktail
Continue reading » At the upcoming AAG conference in New York, I’ll be presenting a recent prototype that links agent-based simulation with current traffic flow models.
The basic premise is that any cognitive decision associated with movement around cities should be mo…
A joint project has been set up between ONS and University College London to develop a new UK Output Area Classification, for which we are seeking your views and thoughts. The new Output Area Classification is planned to be created using 2011 Census data, when available, and is relevant to anyone interested in social area […]
Continue reading »A joint project has been set up between ONS and University College London to develop a new UK Output Area Classification, for which we are seeking your views and thoughts. The new Output Area Classification is planned to be created using 2011 Census data, when available, and is relevant to anyone interested in social area […]
Continue reading »A joint project has been set up between ONS and University College London to develop a new UK Output Area Classification, for which we are seeking your views and thoughts. The new Output Area Classification is planned to be created using 2011 Census …
Continue reading »
Athene Donald posted recently on imposter syndrome, that feeling that we’re doing something way beyond our capabilities, perhaps due to clerical error or overenthusiastic “brand management”*. As I’ve touched on before, working in an interdisciplinary team exacerbates that. I’ve heard … Continue reading →![]()
The purpose of my previous post on the TransXChange timetable data was to make it possible to track National Rail trains in real time. Due to the large number of stations making up the network and the fact that you can’t obtain information for a whole line in one go, the only viable option is … Read more →
Continue reading »This week’s teaser is about the London tube network: Which is the only London Underground station whose name does not include any of the letters in the word ‘Mackerel’? With…
Continue reading »Here is a new book on complexity and cities entitled “Complexity Theories of Cities Have Come of Age: An Overview with Implications to Urban Planning and Design” edited by Juval Portugali, Han Meyer, Egbert Stolk and Ekim Tan with the …
Continue reading »A new book on complexity and cities edited by Juval Portugali, Han Meyer, Egbert Stolk and Ekim Tan with the intriguing title that what we do has come of age. Well maybe, maybe not, I leave you to be the … Continue reading →
Continue reading »Carrying on form our previous post – Origins vs. Destinations
visualises data drawn from a random sample of New York City Yellow Cab GPS data collected in 2010:
Programmed by Juan Francisco Saldarriaga, Spatial Information Design Lab, Graduate…
Continue reading »