

Mapping London’s Twitter Activity in 3d
 |
|
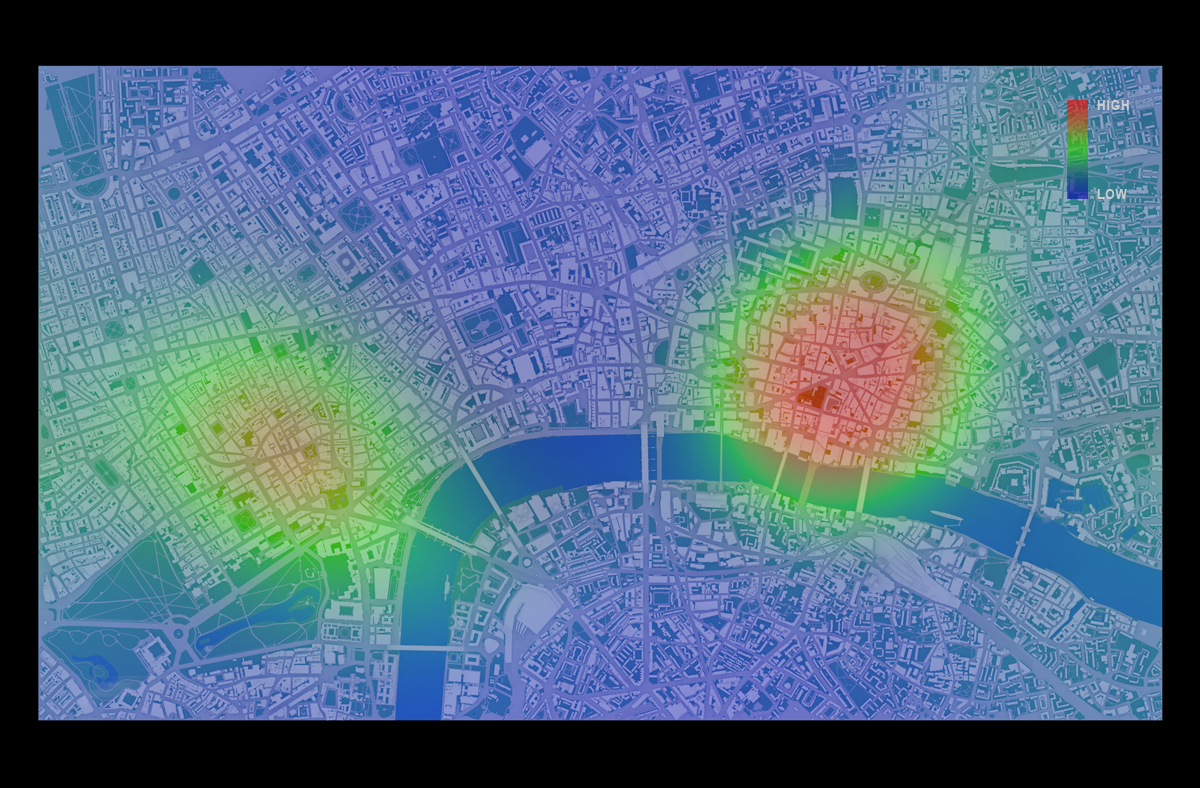
Image 1. The tweet density from 8am to 4pm on 20th June 2015, Central London
|
Twitter Mapping is increasingly useful method to link virtual activities and geographical space. Geo-tagged data attached to tweets containing the users’ location where they tweeted and it can visualise the locations of users on the map. Although the number of the geo-taggedtweets is a relatively small portion of all tweets, we can figure out the density, spatial patterns and other invisible relationships between online and offline.
Recently, studies with geo-tagged tweets have been developed to analyse the public response tospecific urban events, natural disasters and regional characteristics (Li et al., 2013) [1]. Furthermore, it is extending to traditional urban research topics, for example, revealing spatial segregation and inequality in cities (Shelton et al., 2015) [2].
Twitter mapping in 3D can augment 2d visualisation by providing built environment contexts and improved information. There are many examples of Twitter mapping in 3d such as A) #interactive/Andes [3] , B) London’s Twitter Island [4], C) Mapping London in real time, using Tweets [5]. A) and B) build up 3d mountains of the geo-tagged tweet on the map. In the case of C), when the geo-tagged tweets are sent in the city, the heights of nearest buildings increase in the 3d model. These examples are creative and show different ways to view the integrated environments.
From a Networking City’s view, if we make a Twitter visualisation more tangible in a 3d urban model, it would help us to have a better understanding how urban environments are interconnected with the invisible media flow.
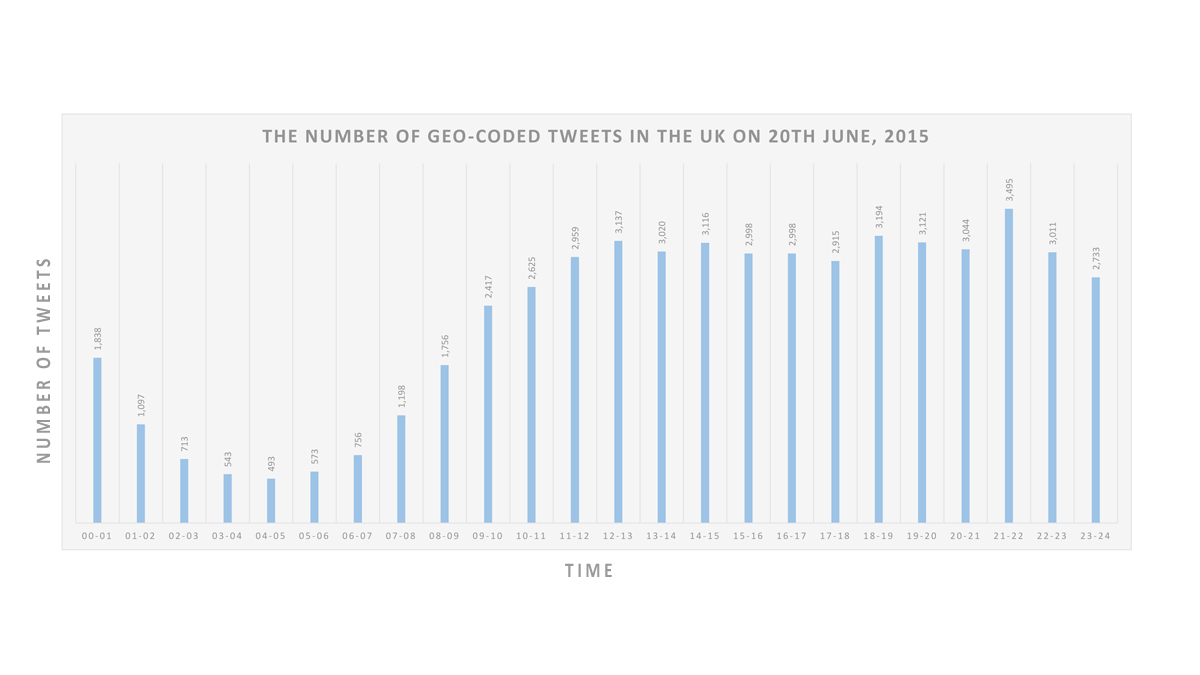
To make the visualisation, the Twitter data has been collected by using Big Data Toolkit developed by Steven Gray at CASA, UCL. All 53,750 geo-tagged tweets are collected on 20thJune, 2015 across the UK. As we can see from Table 1, the number of tweets was at the lowest point at 5am and reached to the highest point at 10pm with 3495 tweets. Moreover, Video 1 shows the location of the data in the UK and London on that day in real time.
 |
|
Table 1. The Number of Geo-Coded Tweets in the UK on 20th June, 2015
|
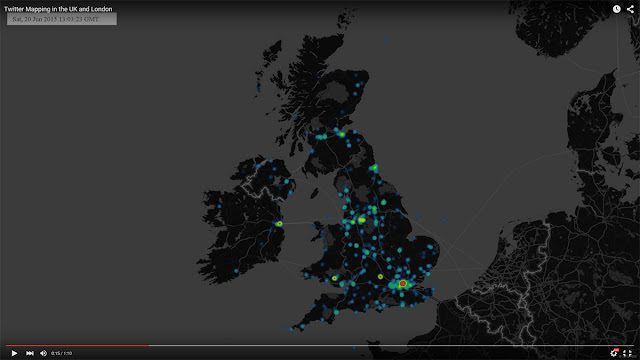
Video 1. The location of Geo-Coded Tweets in the UK on 20th June, 2015
When we calculate the density of the data, London, particularly Central London, contains the largest number of the tweets. (Image 2)
 |
| Image 2. The density of Geo-Coded Tweets in the UK on 20th June, 2015 |
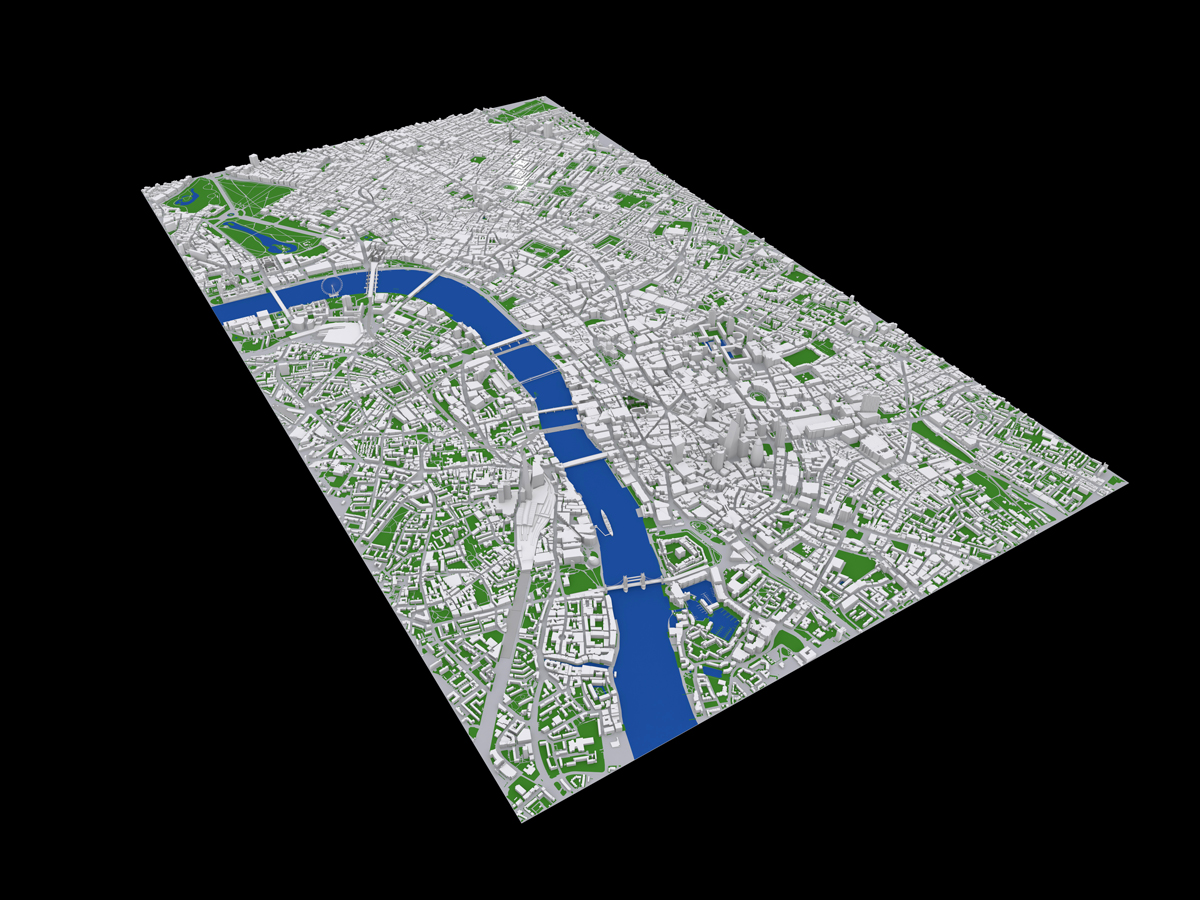
In order to focus on the high density data, 6 km x 3.5 km area of Central London is chosen for the 3d model. Buildings, bridges, roads and other natural environments of the part of London have been set in the model based on OS Building Heights data[6]. Some Google 3d warehouse buildings are added to represent important landmark buildings like St.Pauls, London Eye and Tower Bridge as you can see from Image 3, Image 4 and Image 5.
 |
|
Image 3. The plan view of Central London model
|
 |
|
Image 4. The perspective view of Central London model
|
 |
|
Image 5. The perspective view of Central London model (view from BT Tower)
|
The geo-tagged data set is divided into one hour periodsand distributed on the map to identify the tweet density in the area. Through this process, we can see how the density is changing depending on the time period. For example, the tweets are mainly concentrated around Piccadilly Circus and Trafalgar Square between 10am and 11am, but there are two high-density areas between 12pm and 1pm (See Image 6, Image 7, Image 8 and Image 9)
 |
|
Image 6. The tweet density between 10am and 11am on 20th June 2015
|
 |
|
Image 7. The tweet density between 12pm and 1pm on 20th June 2015
|
 |
|
Image 8. The tweet density from 12am to 12pm
|
 |
|
Image 9. The tweet density from 12pm to Midnight
|
As we’ve seen above, the 2d mapping is useful to understand the relative density in one period such as which area is high and which area is low between 12pm and 1pm. However, we cannot understand the degree of intensity in the highest peak areas. It is believed that 3d mapping is needed at this stage. We can clearly see the density of the tweet data in each periodand the intensity of the tweet density across the time periods from Image 10 to Image 14.
West End area shows high density throughout the whole day but City area shows the peak only during lunch time. This pattern likely relates to the activities of office workers in City and leisure/tourist in West End.
 |
|
Image 10. The tweet density in 3d between 10am and 11am on 20th June 2015
|
 |
|
Image 11. The tweet density in 3d between 12pm and 1pm on 20th June 2015
|
 |
|
Image 12. The tweet density in 3d from 12am to 8pm
|
 |
|
Image 13. The tweet density in 3d from 8am to 4pm
|
 |
|
Image 14. The tweet density from 4pm to Midnight
|
________________________________________
[1] Linna Li , Michael F. Goodchild & Bo Xu (2013) Spatial, temporal, and socioeconomic patterns in the use of Twitter and Flickr, Cartography and Geographic Information Science, 40:2, 61-77
[2] Taylor Shelton, Ate Poorthuis & Matthew Zook (2015) Social Media and the City: Rethinking Urban Socio-Spatial Inequality Using User-Generated Geographic Information, Landscape and Urban Planning (Forthcoming), http://papers.ssrn.com/abstract=2571757
[3] Nicolas Belmonte, #interactive/Andes, http://twitter.github.io/interactive/andes/ (Strived on 15th August 2015)
[4] Andy Hudson-Smith, London’s Twitter Island – From ArcGIS to Max to Lumion, http://www.digitalurban.org/2012/01/londons-twitter-island-from-arcgis-to.html#comment-7314
(Strived on 15thAugust 2015)
[5] Stephan Hugel and Flora Roumpani, Mapping London in real time, using Tweets, https://www.youtube.com/watch?feature=player_embedded&v=3fk_qxGZWFQ (Strived on 15th August 2015)
[6] OS Building Heights-Digimap Home Page http://digimap.edina.ac.uk/webhelp/os/data_information/os_products/os_building_heights.htm (Strived on 15th August 2015)
