Digital Representations of Place: Urban Overlays and Digital Justice

Summary of the session on Digital Representation of Place at the RGS-IBG conference in Cardiff. The session aim was to address the following challenge: “Over the last few decades, our cities have become increasingly digital. Urban environments are layered with data and algorithms that fundamentally shape our geographic interactions: impacting how we perceive, move through, … Continue reading Digital Representations of Place: Urban Overlays and Digital Justice

Continue reading »

‘Songdo: the hype and decline of world’s first smart city’ in ‘Sustainable Cities in Asia’

Routledge published ‘Sustainable Cities in Asia’ last September.The book was edited by Federico Caprotti, Associate Professor in Human Geography at the University of Exeter, and Li Yu, Reader in Planning at Cardiff University.It contains 23 chapters th…

Continue reading »

Esri User Conference 2016 – plenary day

The main Esri User conference starts with a plenary day, where all the participants (16,000 of them) join together for a set of presentation from 8:30 to 3:30 (with some breaks, of course). Below you’ll find some notes that I took during the day: The theme of the keynote was GIS – Enabling a Smarter … Continue reading Esri User Conference 2016 – plenary day

Continue reading »

Beyond quantification: a role for citizen science and community science in a smart city

The Data and the City workshop will run on the 31st August and 1st September 2015, in Maynooth University, Ireland. It is part of the Programmable City project, led by Prof Rob Kitchin. My contribution to the workshop is titled Beyond quantification: a role for citizen science and community science in a smart city and is extending a short article from … Continue reading Beyond quantification: a role for citizen science and community science in a smart city

Continue reading »

A sense of new academic term


New academic term of UCL officially started on 22nd September 2014. Thousands of new students walk around the campus, and they fill Bloomsbury area with vibrant energy. Dr. Adam Dennett begun his GI Systems and Science class for new post-graduate students of CASA with welcoming slide on 1st October. In this year, CASA opened two new post-graduate courses: MSc SmartCities and Urban Analytics and MRes Smart Cities. Therefore, he has developed a lot of the course materials and structure for the students during last summer days.


On the same day, when CASA held SHOW AND TELL, which is a traditional CASA event to introduce each other, I apparently realised that the new term is just started! Most members of the lab came up and introduced themselves at this inaugural meeting.  


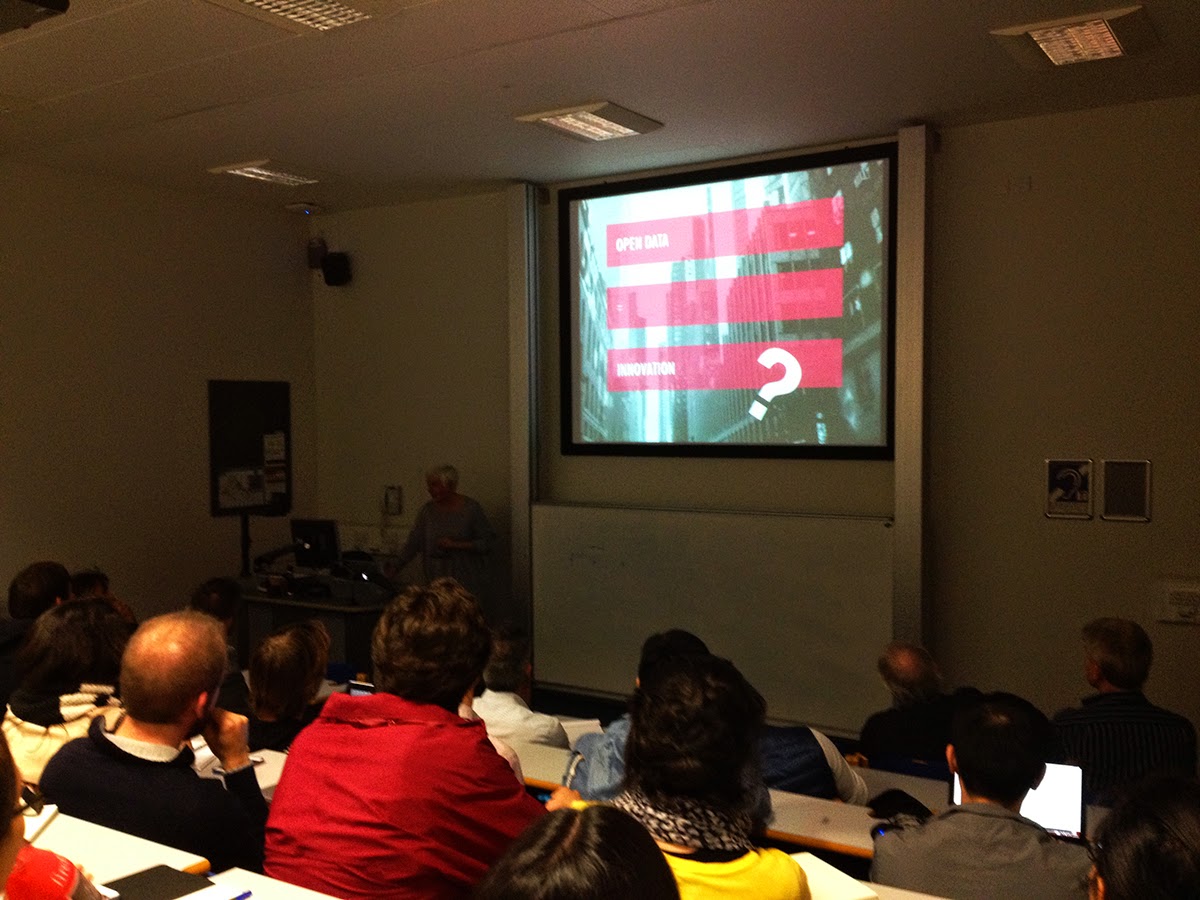
Emer Coleman’s seminar was followed on 7thOctober under the title of “Open Data and the City: Looking back and Looking Forward”. She explained open data as a way of engagement and empowerment and how citizen can be benefited and can participate in making better urban environment. Several good cases, such as Hello Bristol, were mentioned.


After the presentation, many questions were emerging from the audience. Transparency, security, effectiveness and so on. However, I was uncomfortable when she criticised, with some sentences from Adam Greenfield’s “Against the smart city”, big corporations that IBM and Cisco have been pushing smart city idea for money rather than people or better society. I could not catch the difference between the big brands, which get profit by providing new city systems and solutions, and her company, which get profit as well by providing efficient transport solution and application. There might be a matter of size.

These adventures would be enough to feel a sense of the new term. However, UCL email was unusually hacked on 9thOctober. All UCL students got 3000 emails (including me) with bello. It was a big issues not only in the campus but also in the UK as The Independentannounced. Steven Gray, a specialist of large datasets at CASA, analysed what has happened with his Big Data Toolkit and posted it on his blog.
 
Continue reading »

From Rhythmanalyst to Rhythmconductor- Rhythmanalysis: Space, Time and Everyday Life


Image 1. The book cover of ‘Rhythmanalysis: Space, Time and Everyday Life’

 
In the book, Rhythmanalysis: Space, Time and Everyday Life, French sociologist Henri Lefebvre suggests ‘Rhythm’ as an alternative tool to understand and analyse everyday urban life beyond visual recognition. He argues that we can examine the true nature of cities from the human body, the basic unit of urban life, to substantial urban structures through rhythms.


Invisible rhythms are generating, repeating and transforming in cities. Lefebvre categorizes types of rhythm, which deeply intervene the life and make a foundation of law, institution and culture, based on its characteristics. Among them, the author particularly insists to pay attention to two aspects of rhythms that Arrhythmia which is creating discordance between or among two or more rhythms, and Eurhythmia which is staying in the state of harmony and balance. He asserts that it is important to convert Arrhythmia in the city that causes inequality and injustice to Eurhythmia which sustains healthy urban condition.


‘Rhythmanlysist’ is a fresh idea from the book published in 1992. Rhythmanlysist hears sounds of the city and reveals hidden systems behind visual images with sensing and analysing the change of spatial aspects in timing. As a rhythmanlysist, Lefebvre investigates Mediterranean cities. He presents some insights that the rhythms of Mediterranean cities are derived from specific geographical and climate environments, and the rhythms have created different political system and exceptional cultural diversity in contrast to Atlantic cities. Physically, it leads the development of plazas and the importance of stairways which link sloping lands.


Rhythmanlysist could still be a valuable concept to understand complex urban situations. However, we are living in the digital era. As Mitchell (Mitchell, 1999) denoted, the rhythms of our ordinary life are changing by digital communication. Every day tremendous data, which are invisible and inaudible, are generating, and its flows push us into the massive ocean of heterogeneous rhythms. Therefore, new Rhythmanlysist in the digital age needs other capacities. Capturing the digital data in real time and synthesizing it should be essential requirements to create or maintain Eurhythmia. While the cities of the 20th century needed Rhythmanlysist, now it is the time of ‘Rhythmconductor’ who collects digital rhythms, reorganises its tempos-meters-articulations and resonates new contexts. We can easily find good examples of Rhythmconductor like below.
 

Image 2. London Public Bike share map by Oliver O’Brien. http://bikes.oobrien.com/london/

Image 3. Analysis of Happiness on Twitter during 9th September 2008 to 31stAugust 2011.

Dodds PS,  Harris KD,  Kloumann IM,  Bliss CA,  Danforth CM  (2011) Temporal Patterns of Happiness and Information in a Global Social Network: Hedonometrics and Twitter. PLoS ONE 6(12)


This radical change of the rhythm gives an opportunity to redefine the scopes of each social group. Citizens collect and utilize the data by their mobile devices; furthermore, they solve complex urban problems by themselves. (Desouza and Bhagwatwar, 2012) The role of planners is challenging to make new rhythms by spreading effective information and stimulating civic participation using social media instead traditional managers’ role within mainstream planning structures. (Tayebi, 2013) Also, Scientists’ role is shifting. According to Wright (Wright, 2013), scientific researchers had focused to find reasons of urban problems until the last decade, however; their voices are getting stronger to solve problems and provide alternatives in the decision making process with geospatial data and geographical analysis.


You can find the detail of Lefebvre’s book from Google and Amazon.


Desouza, K C and Bhagwatwar, A, 2012, “Citizen Apps to Solve Complex Urban Problems” Journal of Urban Technology 19(3) 107–136.

Mitchell, W J, 1999 E-topia: “Urban life, Jim–but not as we know it” (MIT Press, Cambridge, MA).

Tayebi, A, 2013, “Planning activism: Using Social Media to claim marginalized citizens’ right to the city” Cities 32 88–93.

Wright, D, 2013, “Bridging the Gap Between Scientists and Policy Makers: Whither Geospatial? | Esri Insider” Esri Insider, http://blogs.esri.com/esri/esri-insider/2013/02/11/bridging-the-gap-between-scientists-and-policy-makers-whither-geospatial/.


Continue reading »

Review: Designing for the situated and public visualisation of urban data

Journal of Urban Technology, Volume 19, Issue 2, 2012
Designing for the situated and public visualisation of urban data
by Andrew Vande Moere & Dan Hill

THE authors point out recent urban data visualisation still remains on the stage of simply providing statistical data, and it is ineffective to make better understanding about the interaction of the massive and complex urban data. They argue public policy should be changed to open more public data, which are including local characteristics, to raise public awareness and encourage actionable public participation.

Through five main parts; theoretical part (data and public visualisation) – Recent projects – Student projects – characteristics of urban visualisation – conclusion, this article draws the question and tries to answer against how we can visualise the complex and continuously changing condition of cities, where have different problems by particular factors in different parts within a city, and how we can expect the unpredictable condition in the information age.

The authors premise that the character of place has been formulated by economic and cultural patterns based on the rock of physical and geographical aspects, and these patterns adversely facilitate the physical change.  In the past, the production of the place represented the specific character of the place, and it had coupled with the regional change. However, since cities have transformed their industry from material based to knowledge based, they have been showing the movement of hominization. This paper argues that the character of the city in this era can be revealed by the data, which are endlessly producing in the city, and we can find the difference between cities by the analysis of the data.  Therefore, the urban data is not an indicator of urban activities but also the driving force leading qualitative changing of the urban environment.

Particularly, previous data unilaterally delivered statistical data of urban areas, but recent the urban data stimulate active participation of citizen by well-developed mobile devices and illustrate what feedbacks are creating by the citizen. And the authors emphasize the following elements are essential to visualise the urban data.  
1) Situated : contextual, local, social
2) Informative: feedback, insightful, consistent
3) Functional: medium, participate, opportunistic, aesthetic, trustworthy, persuasive

Despite a lot of attractive contents, the most impressive point in the article is the well-organised logical flow of what they use; Neo-industrial city (production of data) – open data (role of public data) – social visualisation (impact of data) – urban computing (technological integration) – urban scene (combination of data & urban environment), to explain the meaning of data in this period, its social role and the combination with the physical environment. When we consider the vague use and weak logical connection of the concepts surrounding the data and urban areas, it is a profound approach. This article reminds us to make a coherent structure and clear correlation is an critical issue to set up the base of opinion and to insist it by writing.

To cite this article: Andrew Vande Moere & Dan Hill (2012) Designing for the Situated and Public Visualization of Urban Data, Journal of Urban Technology, 19:2, 25-46
 
 
Continue reading »

Review: Designing for the situated and public visualisation of urban data

Journal of Urban Technology, Volume 19, Issue 2, 2012Designing for the situated and public visualisation of urban databy Andrew Vande Moere & Dan Hill THE authors point out recent urban data visualisation still remains on the stage of simply provi…

Continue reading »

Review: Designing for the situated and public visualisation of urban data

Journal of Urban Technology, Volume 19, Issue 2, 2012
Designing for the situated and public visualisation of urban data
by Andrew Vande Moere & Dan Hill

THE authors point out recent urban data visualisation still remains on the stage of simply providing statistical data, and it is ineffective to make better understanding about the interaction of the massive and complex urban data. They argue public policy should be changed to open more public data, which are including local characteristics, to raise public awareness and encourage actionable public participation.

Through five main parts; theoretical part (data and public visualisation) – Recent projects – Student projects – characteristics of urban visualisation – conclusion, this article draws the question and tries to answer against how we can visualise the complex and continuously changing condition of cities, where have different problems by particular factors in different parts within a city, and how we can expect the unpredictable condition in the information age.

The authors premise that the character of place has been formulated by economic and cultural patterns based on the rock of physical and geographical aspects, and these patterns adversely facilitate the physical change.  In the past, the production of the place represented the specific character of the place, and it had coupled with the regional change. However, since cities have transformed their industry from material based to knowledge based, they have been showing the movement of hominization. This paper argues that the character of the city in this era can be revealed by the data, which are endlessly producing in the city, and we can find the difference between cities by the analysis of the data.  Therefore, the urban data is not an indicator of urban activities but also the driving force leading qualitative changing of the urban environment.

Particularly, previous data unilaterally delivered statistical data of urban areas, but recent the urban data stimulate active participation of citizen by well-developed mobile devices and illustrate what feedbacks are creating by the citizen. And the authors emphasize the following elements are essential to visualise the urban data.  
1) Situated : contextual, local, social
2) Informative: feedback, insightful, consistent
3) Functional: medium, participate, opportunistic, aesthetic, trustworthy, persuasive

Despite a lot of attractive contents, the most impressive point in the article is the well-organised logical flow of what they use; Neo-industrial city (production of data) – open data (role of public data) – social visualisation (impact of data) – urban computing (technological integration) – urban scene (combination of data & urban environment), to explain the meaning of data in this period, its social role and the combination with the physical environment. When we consider the vague use and weak logical connection of the concepts surrounding the data and urban areas, it is a profound approach. This article reminds us to make a coherent structure and clear correlation is an critical issue to set up the base of opinion and to insist it by writing.

To cite this article: Andrew Vande Moere & Dan Hill (2012) Designing for the Situated and Public Visualization of Urban Data, Journal of Urban Technology, 19:2, 25-46
 
 
Continue reading »

UCL Urban laboratory pamphleteer – Beyond Quantification: We Need Meaningful Smart Cities

The UCL Urban Laboratory is a cross-disciplinary initiative that links various research interest in urban issues, from infrastructure to the way they are expressed in art, films and photography. The Urban Laboratory has just published its first Urban Pamphleteer which aim to ‘confront key contemporary urban questions from diverse perspectives. Written in a direct and accessible […]

Continue reading »

Lauréat Prix International de Géographie Vautrin Lud

The founder and chair of CASA, Prof. Michael Batty has been awarded the prestigious Lauréat Prix International de Géographie Vautrin Lud, the highest award that can be gained in the field of geography. This prize is widely known as the “Nobel prize of geography”. From 1991, only 22 remarkable researchers were awarded this prize such as David Harvey, Yi-Fu Tuan and Sir Peter Hall.


He has been running his own blog, A Science of Cities, which provides valuable theories, papers and presentation files. Also, he launched a special online class to introduce his complexity theory and methods within Santa Fe Complexity Explorer teaching site. This site is systematically organised with good materials and should be helpful to those who want to learn more about complexity theory and application methods. 


Continue reading »