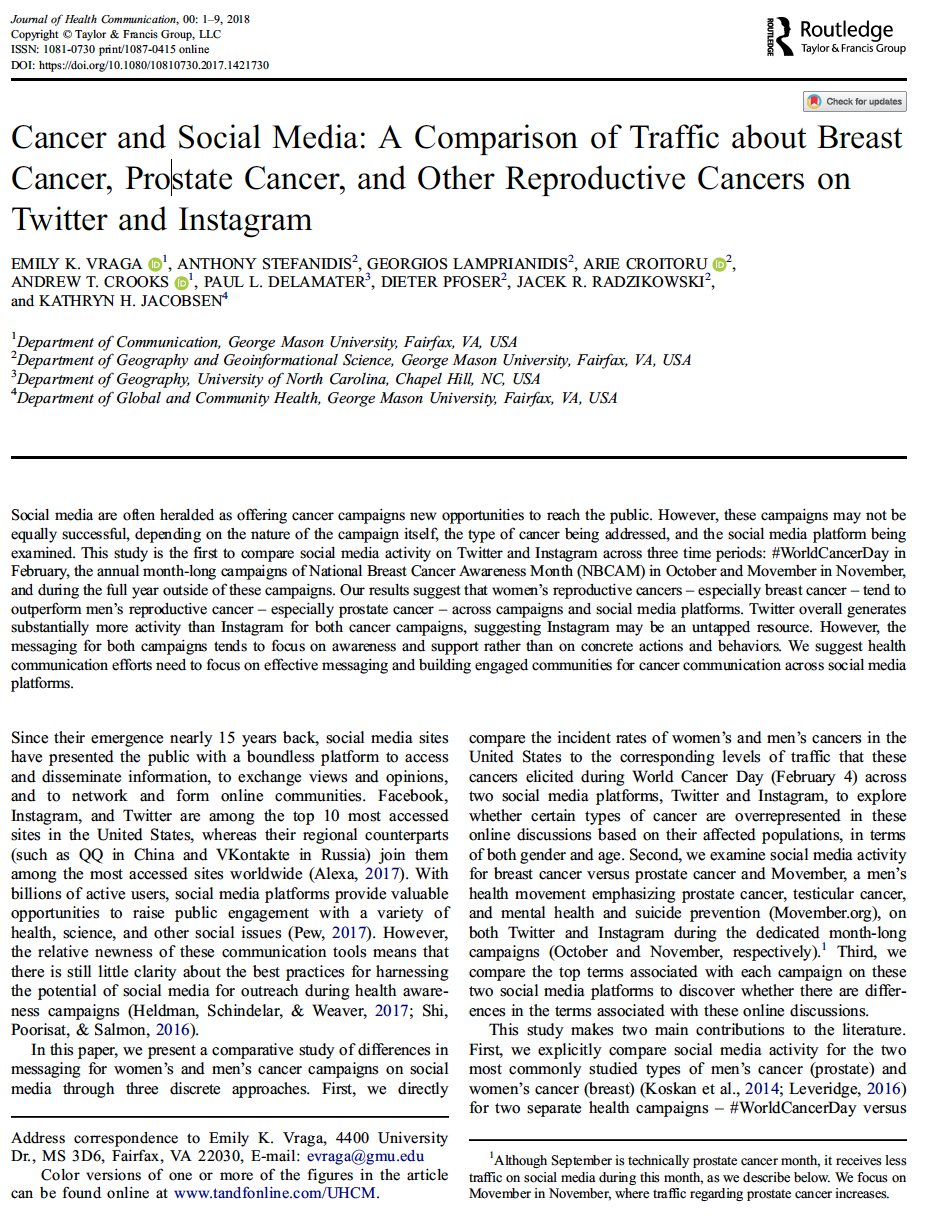
New Paper: Cancer and Social Media
- we directly compare the incident rates of women’s and men’s cancers in the United States to the corresponding levels of traffic that these cancers elicited during World Cancer Day across two social media platforms, Twitter and Instagram.
- we examine social media activity for breast cancer versus prostate cancer on both Twitter and Instagram during the dedicated month-long campaigns (October and November, respectively).
- we compare the top terms associated with each campaign on these two social media platforms to discover whether there are differences in the terms associated with these online discussions.
Abstract:
Social media are often heralded as offering cancer campaigns new opportunities to reach the public. However, these campaigns may not be equally successful, depending on the nature of the campaign itself, the type of cancer being addressed, and the social media platform being examined. This study is the first to compare social media activity on Twitter and Instagram across three time periods: #WorldCancerDay in February, the annual month-long campaigns of National Breast Cancer Awareness Month (NBCAM) in October and Movember in November, and during the full year outside of these campaigns. Our results suggest that women’s reproductive cancers – especially breast cancer – tend to outperform men’s reproductive cancer – especially prostate cancer – across campaigns and social media platforms. Twitter overall generates substantially more activity than Instagram for both cancer campaigns, suggesting Instagram may be an untapped resource. However, the messaging for both campaigns tends to focus on awareness and support rather than on concrete actions and behaviors. We suggest health communication efforts need to focus on effective messaging and building engaged communities for cancer communication across social media platforms.
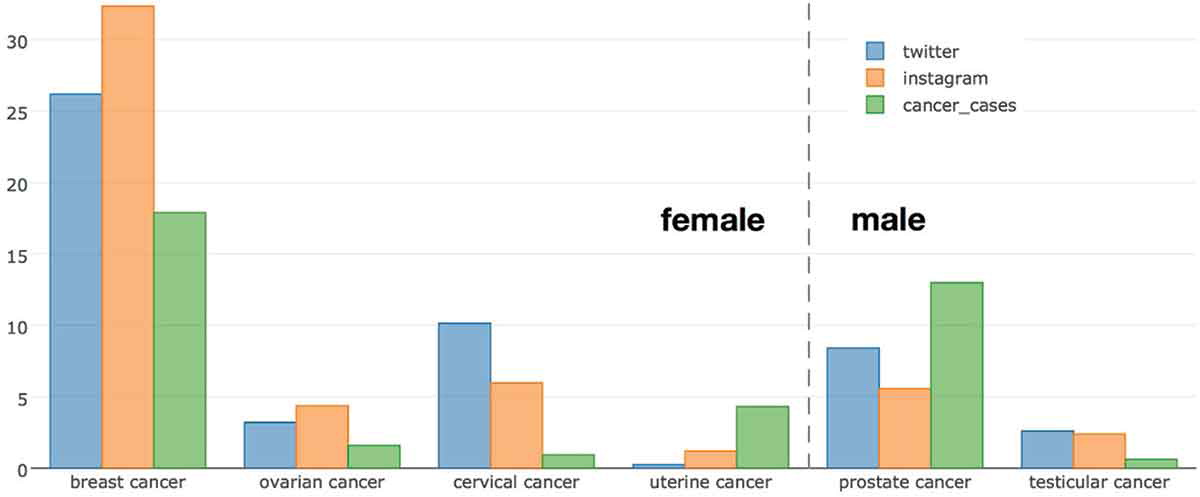 |
| A comparison of percentages of cancer cases (green bars) and references to corresponding cancers in Twitter (blue bar) and Instagram (orange bar) during World Cancer Day 2016. |
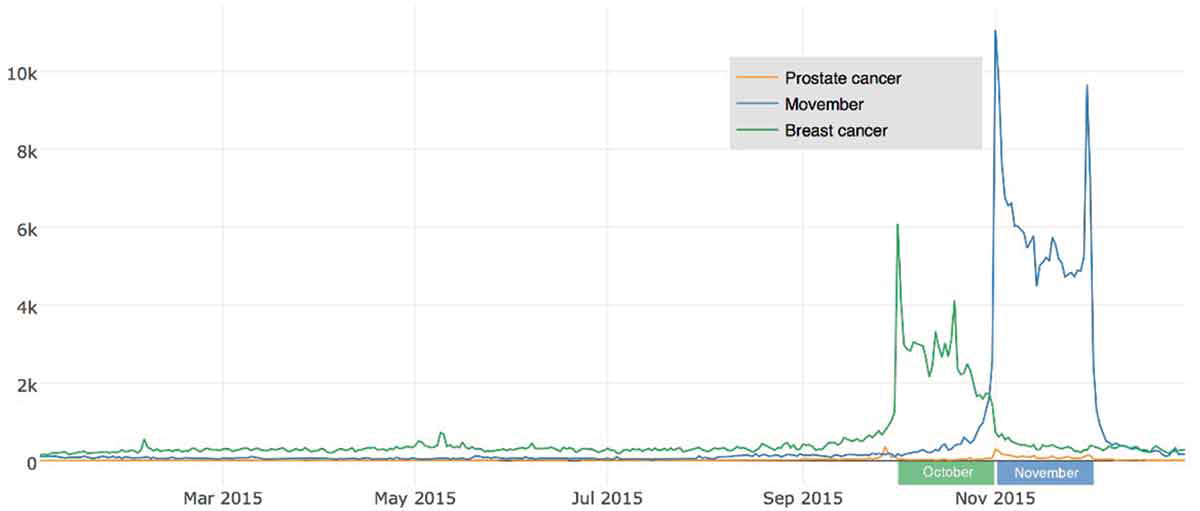 |
| References to breast cancer (green line), prostate cancer (orange line), and Movember (blue line) over the full year 2015 in Instagram. |
Full Reference:
Vraga, E., Stefanidis, A., Lamprianidis, G., Croitoru, A., Crooks, A.T. Delamater, P.L., Pfoser, D., Radzikowski, J. and Jacobsen, K.H. (2018), Cancer and Social Media: A Comparison of Traffic about Breast Cancer, Prostate Cancer, and Other Reproductive Cancers on Twitter and Instagram, Journal of Health Communication. 3(2), 181-189. (pdf)