Traditionally Geographic Information System (GIS) have been exclusively run on the Windows platform. Only very few applications run on either cross platform or exclusively on the Mac. This is part two of a review and introduction to Cartographica, a Mac based GIS software. Find part one with a general introduction HERE and the working with section HERE. This third part is looking at the mobile version for your iPhone or the iPad.
The GIS software are generally quite heavy software packages and with all them functions packed in use a fair bit of processing power. A mobile client is not quite the first choice as a platform for such an app. However, the field is where you get your data from, check on changes or record problems. Having a powerful GIS bases system right there to record the information and look up details makes your life so much easier and quite a bit more fun.
With the new quite powerful handheld devices running iOS this has become a reality and both iPad and iPhone rund GIS packages. Cartographica is offering a Cartographica Mobile app, currently at version 1.1 available now from the itunes app store.
With it you can take data with you out into the field. This is as simple as dropping files into your itunes. It will natively read shape files for example. Each file can be accessed from the mobile app, including layers.
Testing this HERE is a download link for Boris Bike station locations in London from the Guardian Datastore. The data can then be droppend into itunes and opened on the iPad.
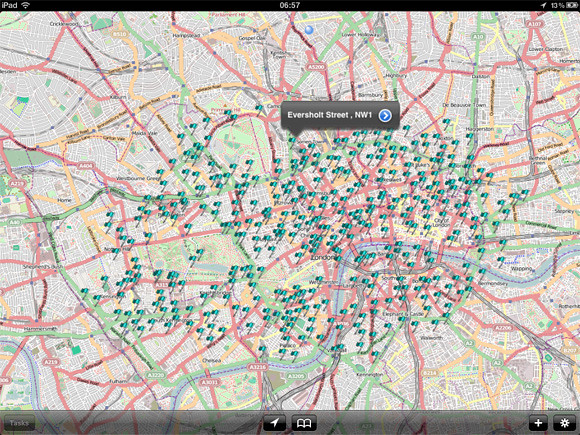
Image by urbanTick / Accessing the data on your iPad. Here showing the Boris Bike station location around London. As a background OSM is used by default.
You can then zoom in and get to the details that are stored with each data point. This is flexible and can be adjusted to the need even out in the field. As done here an field for photo is added and for each location an Photograph can be recorded and linked in directly form the iPad.
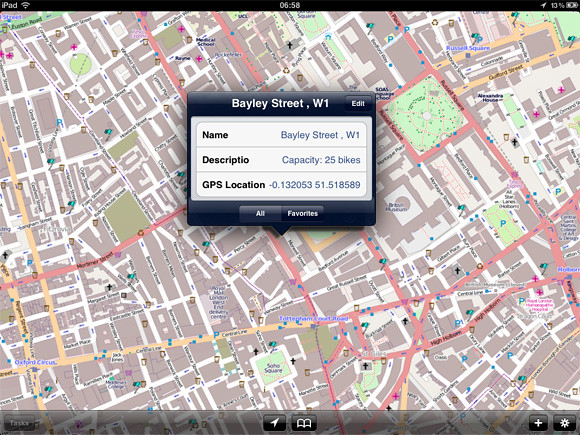
Image by urbanTick / Accessing the data on your iPad. Here showing the Boris Bike station location around London. The details can be accessed individually.
Beside looking at the data and access it new data points can be created. There is a plus button at the bottom of the screen or by keeping your finger on the screen also will bring up a zoom functions with witch a point can be manually located. Alternatively the GPS can be used to add a point at the current location.
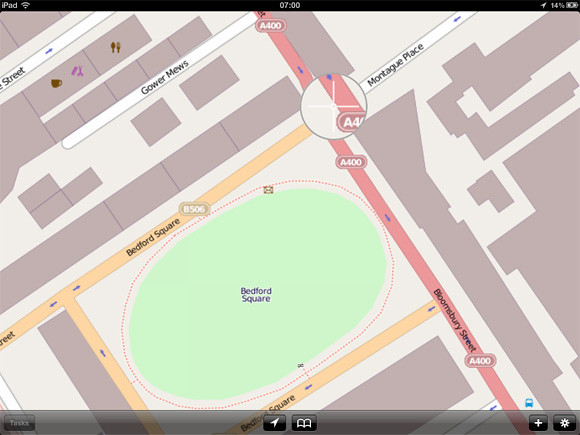
Image by urbanTick / Adding data directly on your iPad. The cross zoom helps definitely place a new data point.
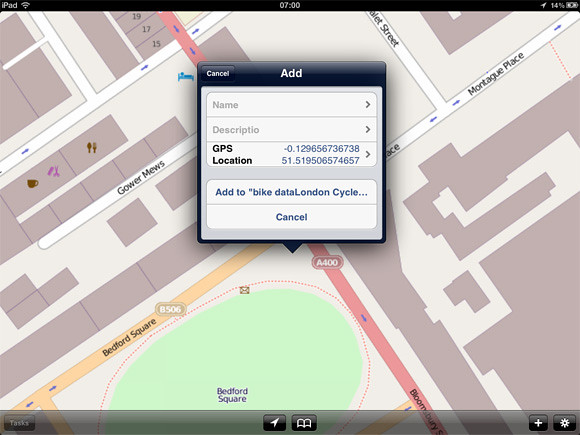
Image by urbanTick / Adding data directly on your iPad. The pop up dialoge lets you fill in the preset fields. Those can be manipulated on the go and new ones can be added or old ones deleted.
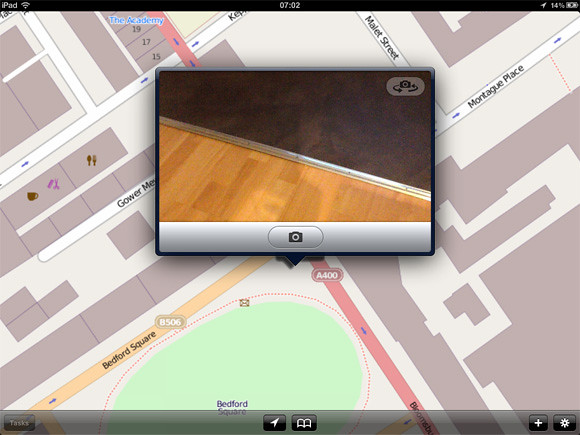
Image by urbanTick / Adding data directly on your iPad. Using the iPad camera to add photographs of the location, or anything else.
What can’t be done on the go is any processing. The station platform of Cartographica offers a range of tools to analyse and visualise the data (see previous post HERE.) The mobile verson as of now does not include any of this. As such the mobile app goes as an addon rather than a replacement. It is intended to take the data with you check, extend or create and bring it back for analysis and further processing.
Nevertheless, Cartographica Mobile does integrate with a network and multiple users including live updating. This opens up possibility for collaborative work on the move and in the field. This is very need and helpful in many cases.
The Cartographica Mobile version is available from the itunes app store at a price of £54.99 or the equivalent of your currrency. It is available world wide. The Cartographica workstation software is available form the web store at a price of $495 and as an academic student license for only $99 for one year. This is tremendously good offer, especially if compared to some of the other packages prices.
Continue reading »